Figure 2.
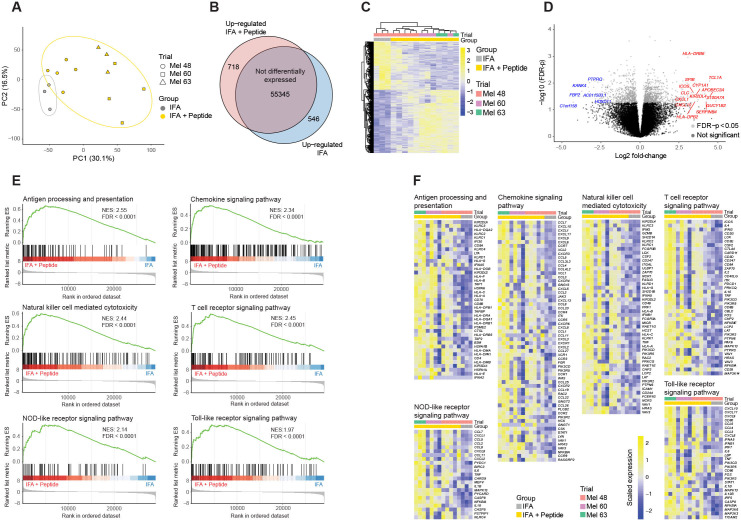
Peptide is a critical component of the early immune response and stimulates antigen presentation in the vaccine-site microenvironment. (A) Principal component analysis demonstrating grouping of the IFA alone and IFA + peptide treated samples. Principal component analysis of PC3 and PC4 are shown in online supplemental figure 1. (B) Results of the differential gene expression analysis showing the number of genes upregulated in the IFA + peptide and IFA alone groups. (C) Heatmap of the differentially expressed genes (DEG’s) with unsupervised clustering of samples. (D) Volcano plot of the DEG’s in gray. Genes labeled in red and blue are in the group of top 20 most differentially expressed by FDR-p <0.05 and ranked by log2 fold change. (E) Selected gene set enrichment analysis plots of highly altered immune related pathways. (F) Heatmaps of the leading-edge genes contributing to the enrichment score in the selected pathways. FDR, false discovery rate; FDR-p, FDR corrected p value; IFA, incomplete Freund’s adjuvant; NES, normalized enrichment score; P, peptide.

