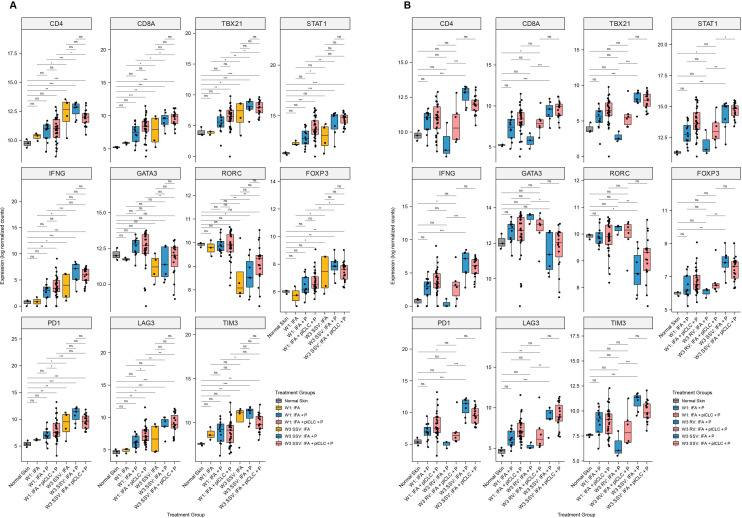
Figure 5.
Expression of selected T cell transcription factor and exhaustion marker genes in the vaccine-site microenvironment according to treatment group and injection strategy. (A) Comparisons demonstrating the effect of pICLC at week 3 compared with week 1 after repeated same-site injection. (B) Comparisons after rotating vaccine injections compared with same-site injections. Boxplots denote the median and IQR, and boxes are colored according to vaccine formulation. Expression is shown as log normalized counts. Total n=90 samples. All p values were FDR-corrected. *FDR-p <0.05, **FDR-p <0.01, ***FDR-p <0.001, ****FDR-p <0.0001. FDR, false discovery rate; IFA, incomplete Freund’s adjuvant; IFN, interferon; ns, not significant; P, peptide; pICLC, polyICLC; RV, rotating-site vaccination; SSV, same-site vaccination; W1, week 1; W3, Week 3.w

