
Figure 3.
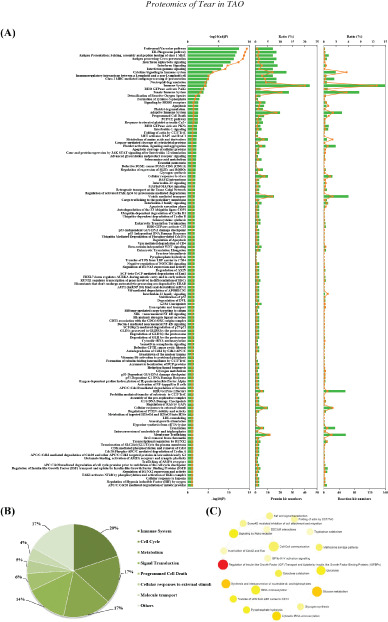
Classification statistics of significantly enriched pathways by REAC were shown in Figure 2B. Enrichment analysis methods were described in the Methods section. (A) Enrichment pathways by REAC analysis. Left: -log(adjP) and -log(P) were shown as line chart and column. Middle: numbers and ratio of DEPs involved in enrichment pathways were shown as column and line chart. Right: numbers and ratio of reactions were shown as column and line charts. (B) Statistical results of classification shown in A. (C) Interactions among these significantly changed pathways by NetworkAnalyst.