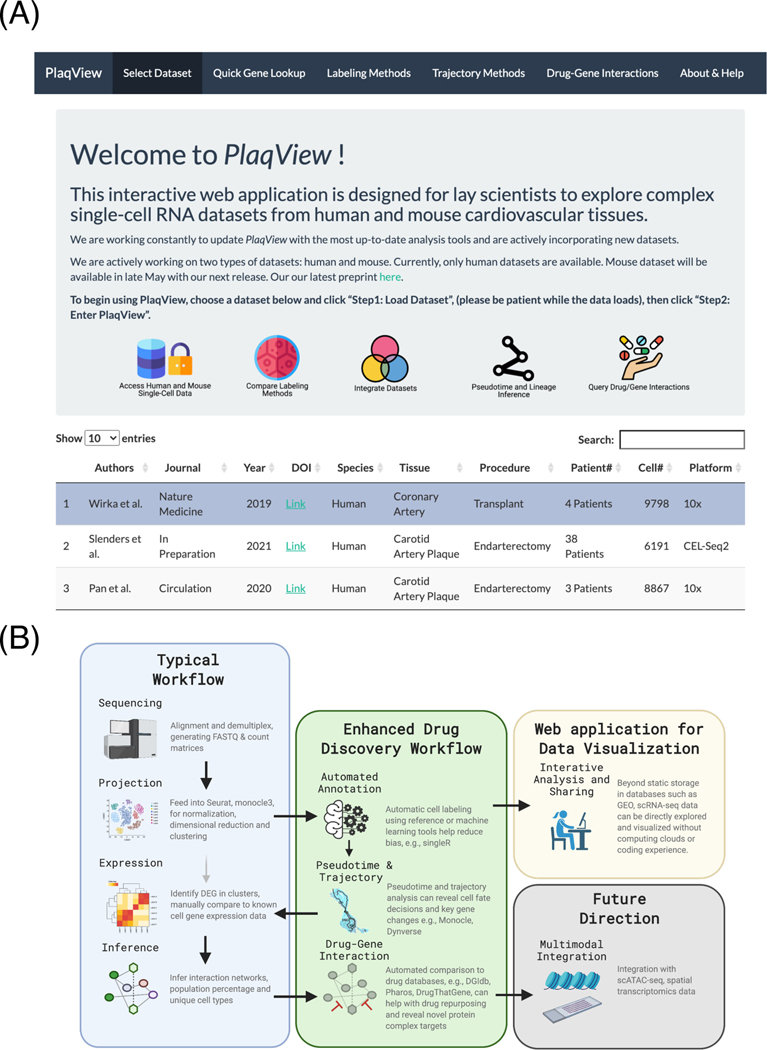
Figure 4.
PlaqView and its analysis pipelines are reproducible, user-friendly tools for single-cell data analysis and presentation.
(A) Screenshot of the PlaqView web application. (B) A roadmap of enhanced scRNA-seq analysis steps. Instead of cluster-based grouping, our pipeline uses automatic cell labeling, coupled with pseudotime trajectory, cellular network interaction and drug targeting, and provides a reproducible process for scRNA datasets. From this roadmap, it is easy to add additional analysis tools and modify workflow as more tools and datasets become available.

