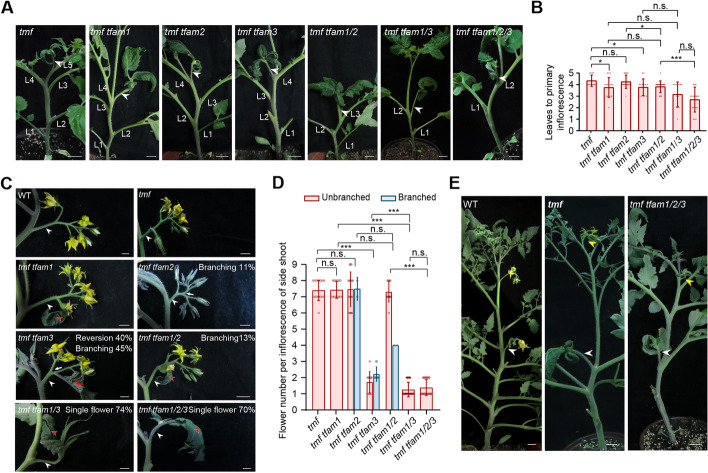
Fig. 2.
Genetic interactions between TMF and TFAM genes. A, B Representative shoots with primary inflorescence (A) and quantification of flowering time (B) for tmf single mutant and higher-order mutants of tmf and tfams. White arrowheads indicate single-flowered primary inflorescences. Data are means ± SD (n = 12, 16, 16, 13, 22, 13, 20, *P < 0.05, **P < 0.01, ***P < 0.001, Student t-test). L, leaf. Scale bars, 2 cm. C, D Images of inflorescence (C) and quantification of flower number per inflorescence (D) from side shoots of various mutant combinations. Red arrowheads indicate leaf-like sepal, and white arrowheads indicate inflorescences. Data are means ± SD (n = 15, 14, 19, 20, 15, 22, 25, ***P < 0.001, Student t-test). Scale bars, 1 cm. E Representative shoot with two successive inflorescences for WT, tmf single mutant and tmf tfam1/2/3 quadruple mutant. White arrowheads and yellow arrowheads indicate primary inflorescences and side-shoot inflorescences, respectively. Scale bars, 2 cm

