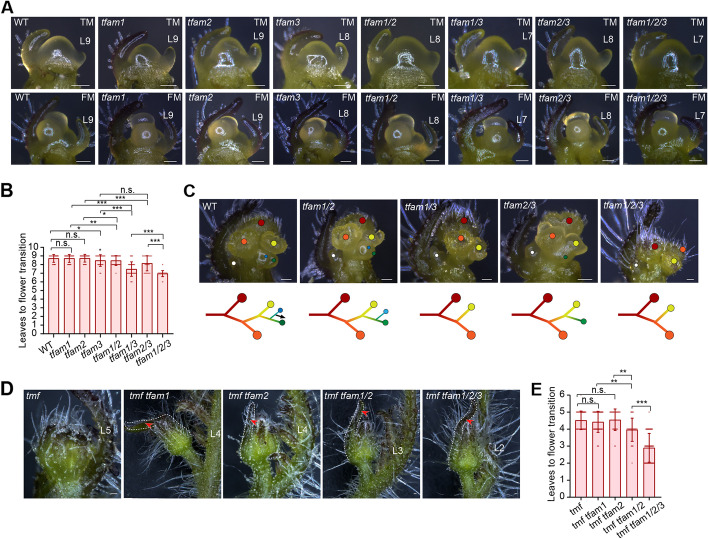
Fig. 3.
Developmental basis of shoot apical meristem maturation in single and higher-order mutants of TFAMs. A, B Stereoscope images of meristems (A) and quantification data of leave primordium production for flower transition (B) from WT and tfam single, double, and triple mutants. Data are means ± SD (n = 69, 46, 46, 42, 59, 54, 39, 73, *P < 0.05, **P < 0.01, ***P < 0.001, Student t-test). Scale bars, 100 μm. L, leaf. C Young inflorescences (upper) and diagrams (bottom) of WT and tfam mutants. Colored dots indicate terminated FM (red, orange and yellow dots) and initiated sympodial inflorescence meristem (SIM) (blue and green dots). White dots indicate the first sympodial shoot meristem (SYM). The black arrow indicates continued SIM reiteration. Scale bars, 100 μm. D, E Stereoscope images of floral meristem (D) and quantification of leaf production for flower transition (E) from tmf and tfam mutants. Data are means ± SD (n = 53, 42, 29, 29, 62, **P < 0.01, ***P < 0.001, Student t-test). Red arrowheads indicating the leaf sepal at floral meristem stage. Scale bars, 100 μm. L, leaf

