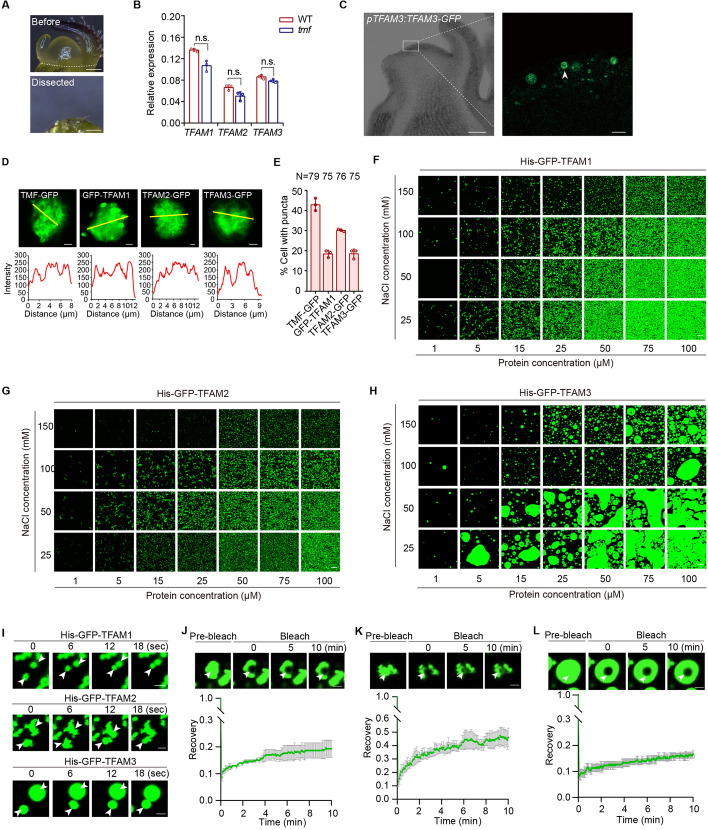
Fig. 4.
TFAM proteins undergo phase separation in vivo and in vitro. A Stereoscope images of the micro-dissected transitional meristem for ddPCR. White dashed line indicates the dissection position. Scale bars, 100 μm. B The relative expression of TFAM1, TFAM2 and TFAM3 were normalized to UBIQUITIN (UBI), respectively. Data are presented as three technical replicates. Data are means ±SD (n = 3, Student t-test). Three independent experiments with similar results were carried out. C Images showing the TFAM3 condensates in the shoot apical meristem of pTFAM3:TFAM3-GFP transgenic plants. Scale bars, 50 μm (left), 5 μm (right). D Subcellular localization of TFAMs showing condensates in the nucleus of tomato cells (upper) and fluorescence intensity of indicated yellow lines (bottom). Scale bars, 2 μm. E Quantitative data showing the percentage of cells with condensates for GFP fusion proteins of TMF, TFAM1, TFAM2, and TFAM3 in the nucleus. Data are presented as three biological replicates ±SD (n = 79, 75, 76, 75). F–H Phase separation of GFP-TFAM1 (F), GFP-TFAM2 (G), and GFP-TFAM3 (H) under the different combinations of indicated concentrations for NaCl and proteins. Scale bars, 20 μm. Three independent experiments with similar results were performed. I Representative images from three independent fusion events showing the liquidity of GFP-TFAM1 (upper), GFP-TFAM2 (middle), and GFP-TFAM3 (bottom) during phase separated droplets formation. Protein concentration, 15 μM; NaCl concentration, 25 mM. Scale bars, 2 μm. J–L Representative images and quantification data of FRAP analysis for GFP-TFAM1 (J), GFP-TFAM2 (K), and GFP-TFAM3 (L). Data are means of three independent FRAP events. Scale bars, 2 μm

