Fig. 6.
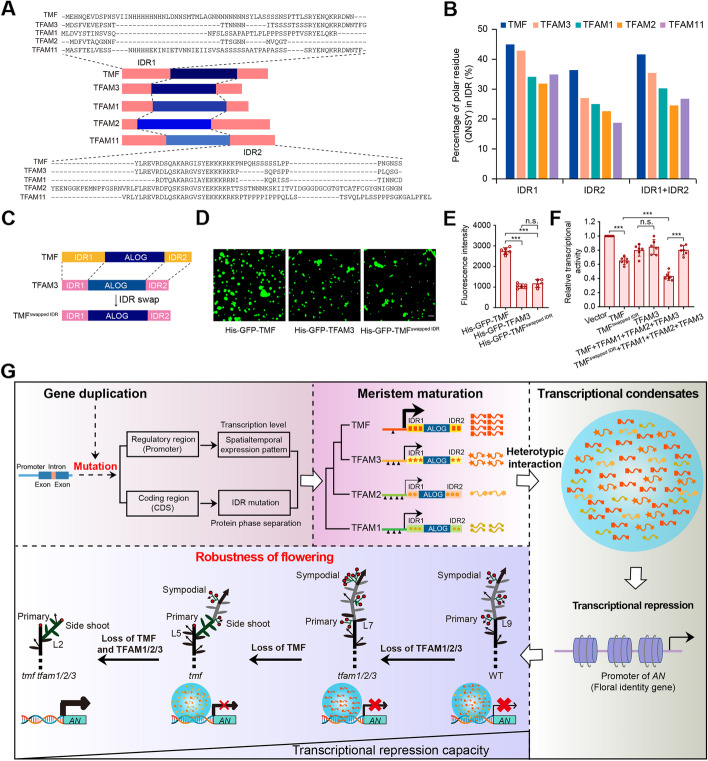
IDR variation determines phase separation and transcription regulating activity of TMF family proteins. A IDR comparisons between TMF family proteins. B Quantification of polar residues for Gln (Q), Asn (N), Ser (S), and Tyr (Y) in IDRs. C Schematic of IDR swap between TMF and TFAM3. D, E Representative images (D) and quantification (E) of phase separation for TMF, TFAM3 and IDR swapped TMF proteins in vitro. Protein concentration, 5 μM. NaCl concentration, 50 mM. Scale bar, 20 μm. Data are presented as six biological replicates. Data are means ± SD (n = 6, ***P < 0.001, Student t-test). F Transcriptional repression of AN by transcriptional condensates formed from TMF, TMFswapped IDR, and TFAM proteins. The ratio of GUS to LUC indicates relative transcriptional activity. LUC served as an internal control. Data are presented as six biological replicates from two independent experiments. Data are means ±SD (n = 6, ***P < 0.001, Student t-test). G Working model for flowering robustness achieved by heterotypic interaction and transcriptional condensation of ALOG family paralogs

