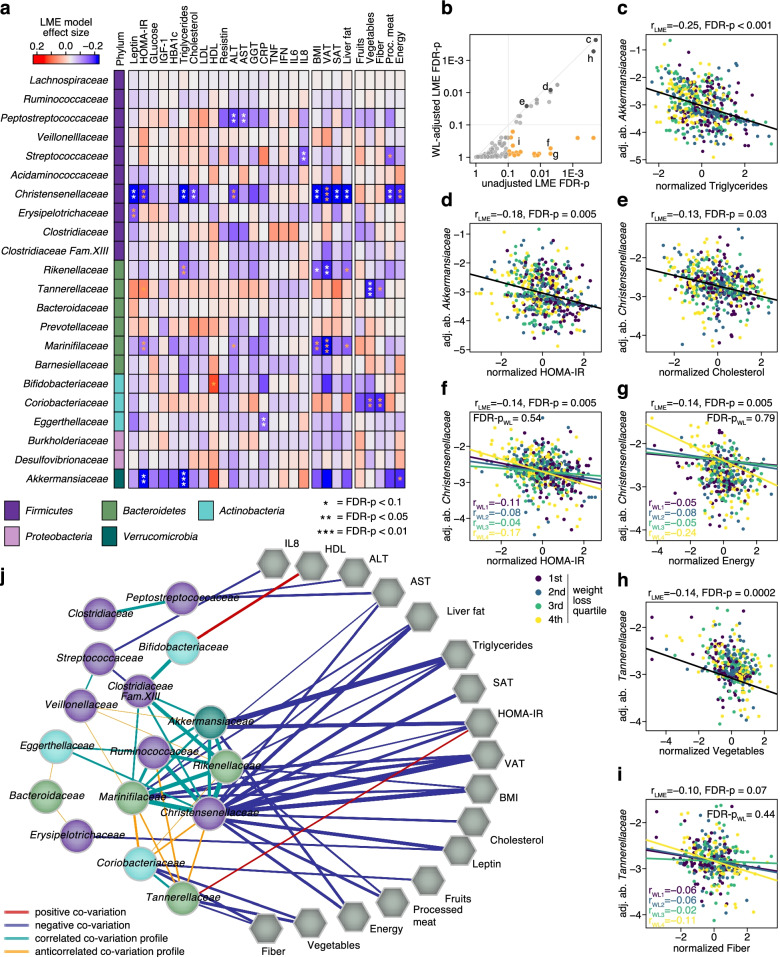
Fig. 6.
Association of the microbiome with anthropometric measurements, metabolic biomarkers, and dietary intake across timepoints. Several core families within the gut microbiome significantly co-vary with some of the clinical biomarkers, body composition measures, and dietary intake assessed in the trial. a Heatmap showing the strength of association calculated irrespective of weight loss quartile or outcome. Phylum affiliation for each family is indicated as a colour strip on the left. Significance for each association after FDR correction is indicated by asterisks (q < 0.1 (*), q < 0.05 (**), and q < 0.01 (***)). Asterisks colored yellow were no longer significant after adjustment for weight loss in the LME models. b Many of the associations shown in a were consistent, even after adjusting for weight loss in the LME models. The yellow points represent the associations for which significance was lost after adjustment for weight loss. c–i Scatterplots for selected significant associations based on the LME models in a. Log-transformed relative abundances of gut bacterial families were corrected for participant-specific offsets using the regression intercepts. The regression slopes for each weight loss quartile has been shown for associations that were significantly influenced by the degree of weight loss (refer to legend) (raw LME model plots without individual-specific abundance correction are shown in Figure S7). j Correlation network between bacterial families and anthropometric measurements, clinical markers and food and energy intake based on the data from a. The network includes bacterial families with at least one significant association to any of the aforementioned parameters and other families that show significant correlation across LME model coefficients (rows of the heatmap in a) with any of those families (Spearman correlation q < 0.05, edge thickness proportional to rho). Edges between families and the parameters are included if the absolute effect size (estimated by the LME) exceeded 0.075 (significant associations are indicated by stronger edges). Additional file 7: Source data 6.

