Fig. 5.

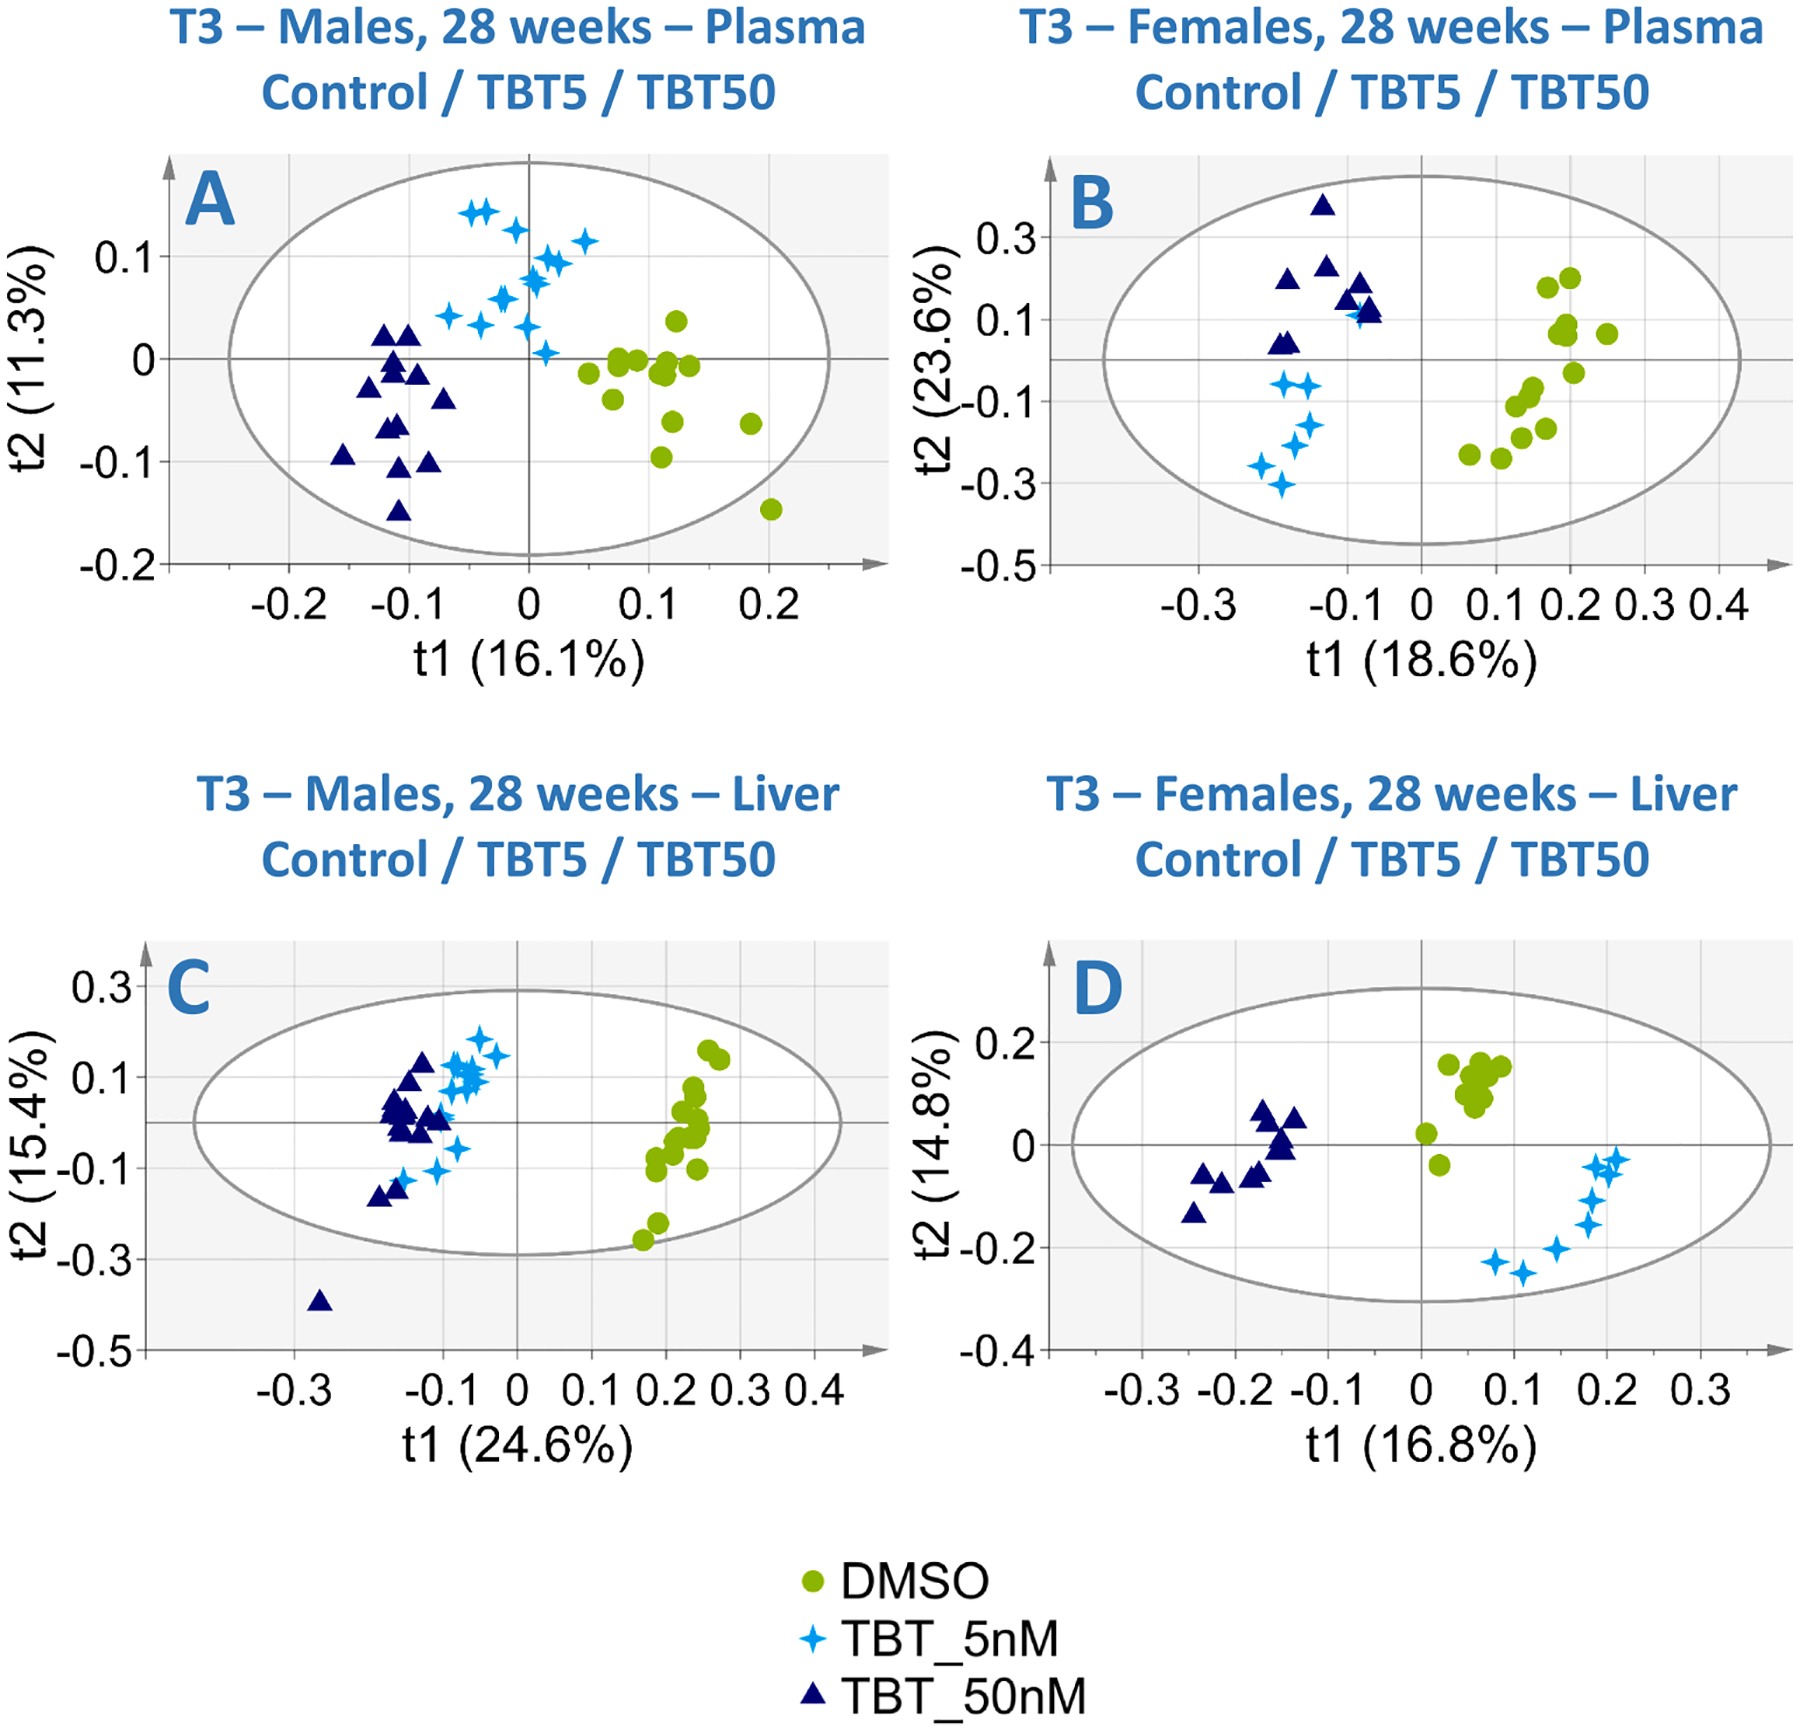
Two-dimensional PLS-DA scores plot of T3 study plasma samples (top) and liver extracts (bottom) integrated 1H NMR spectra at 28 weeks of age. Left column: Male samples; Right column: Female samples. Each dot represents an observation (animal), projected onto first (horizontal axis) and second (vertical axis) PLS-DA components. Groups are shown in different symbols and colors. The black ellipse determines the 95% confidence interval, which is drawn using Hotelling’s T2 statistic. A. Male plasma samples (Control: n = 14, TBT5: n = 14, TBT50: n = 13, 4 latent components, R2Y = 95.5%, Q2 = 0.86). B. Female plasma samples (Control: n = 14, TBT5: n = 7, TBT50: n = 9, 2 latent components, R2Y = 70.5%, Q2 = 0.52). C. Male liver extracts (Control: n = 17, TBT5: n = 16, TBT50: n = 16, 1 latent component, R2 = 48.9%, Q2 = 0.49). D. Female liver extracts (Control: n = 13, TBT5: n = 8, TBT50: n = 11, 4 latent components, R2 = 98.0%, Q2 = 0.95).
