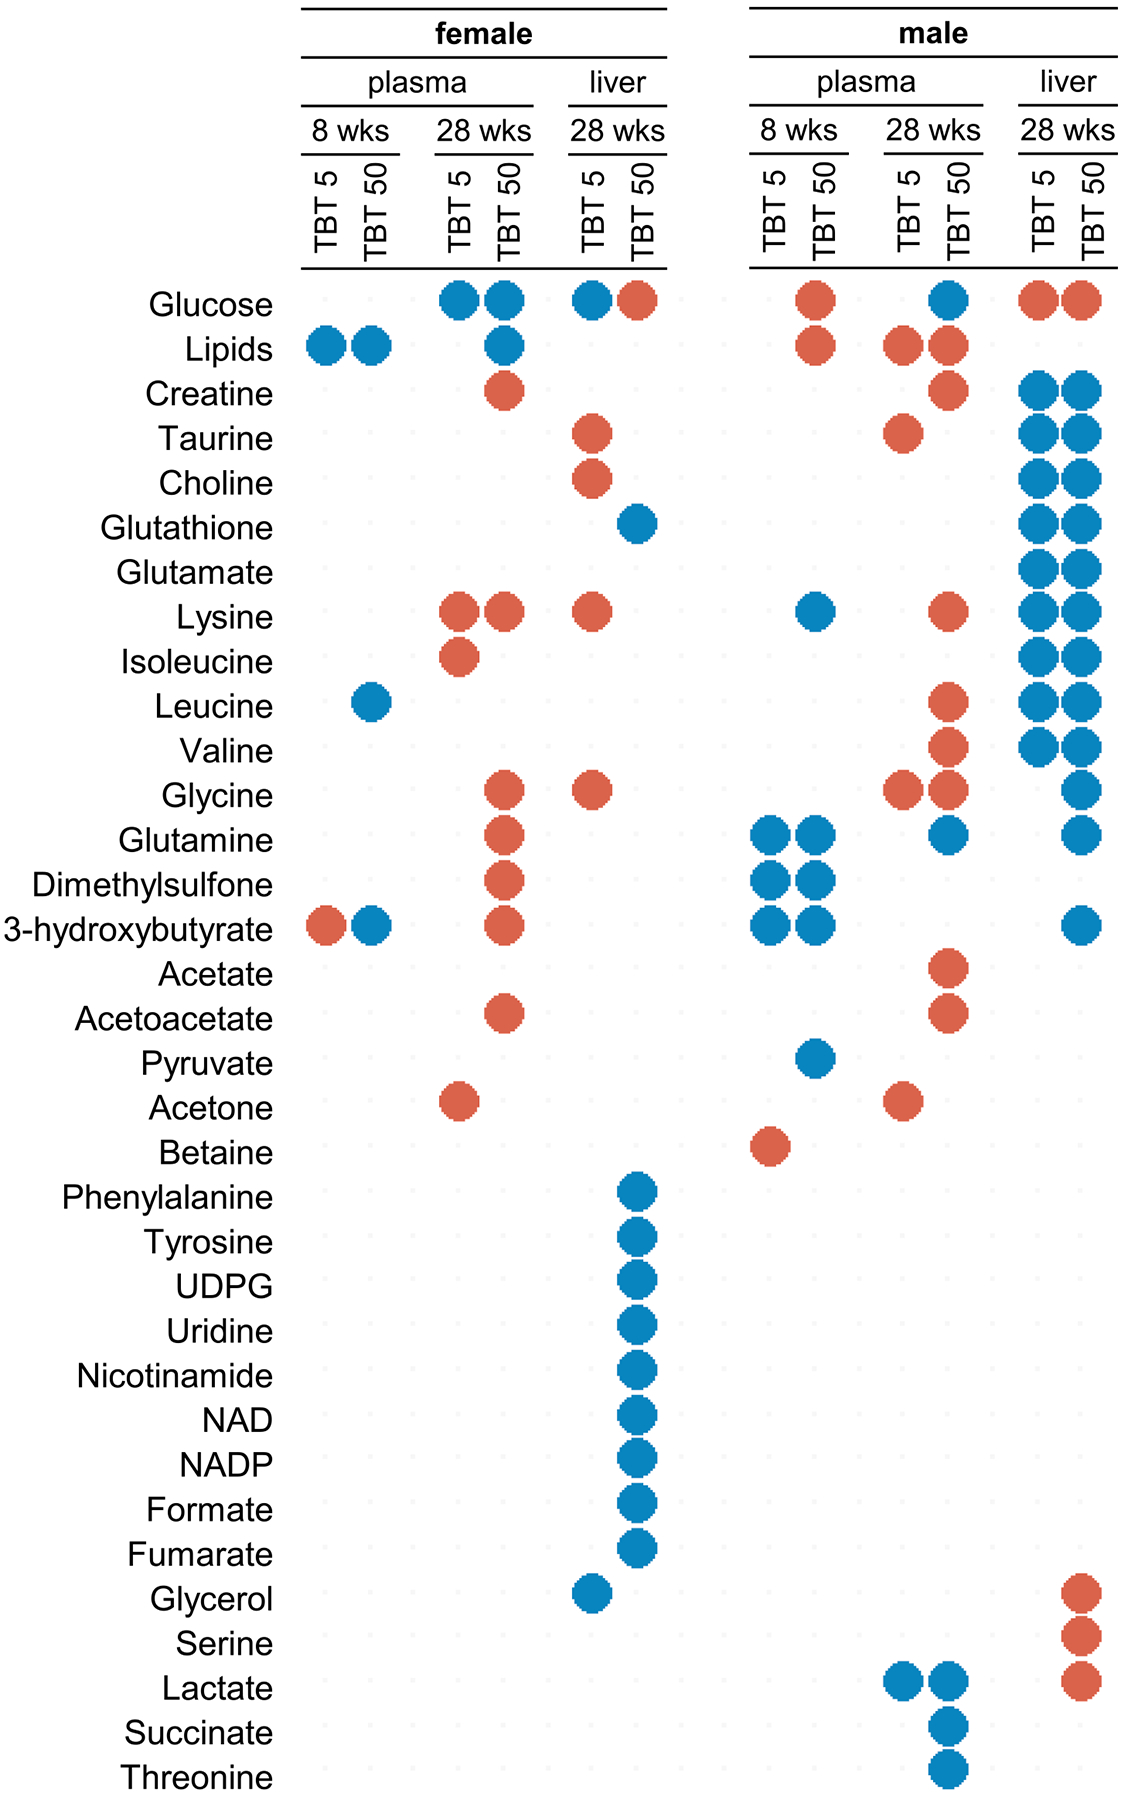
Fig. 6.

Discriminant metabolites identified in plasma and liver extract samples from the pairwise comparison of PLS-DA models (after OSC filtration) for control vs TBT (5 or 50 nM) exposed groups, for male and female mice, at 8 weeks and 28 weeks, respectively. Metabolites with a VIP value > 0.8 and with significant difference between exposed and control groups (FDR corrected p-value < 0.05 based on the Wilcoxon test) were considered as discriminant and are displayed. Blue dots indicate a decrease in metabolite level in TBT exposed groups (TBT 5 or 50 nM) compared to control animals, red dots indicate an increase in metabolite level in TBT exposed groups compared to control animals.
