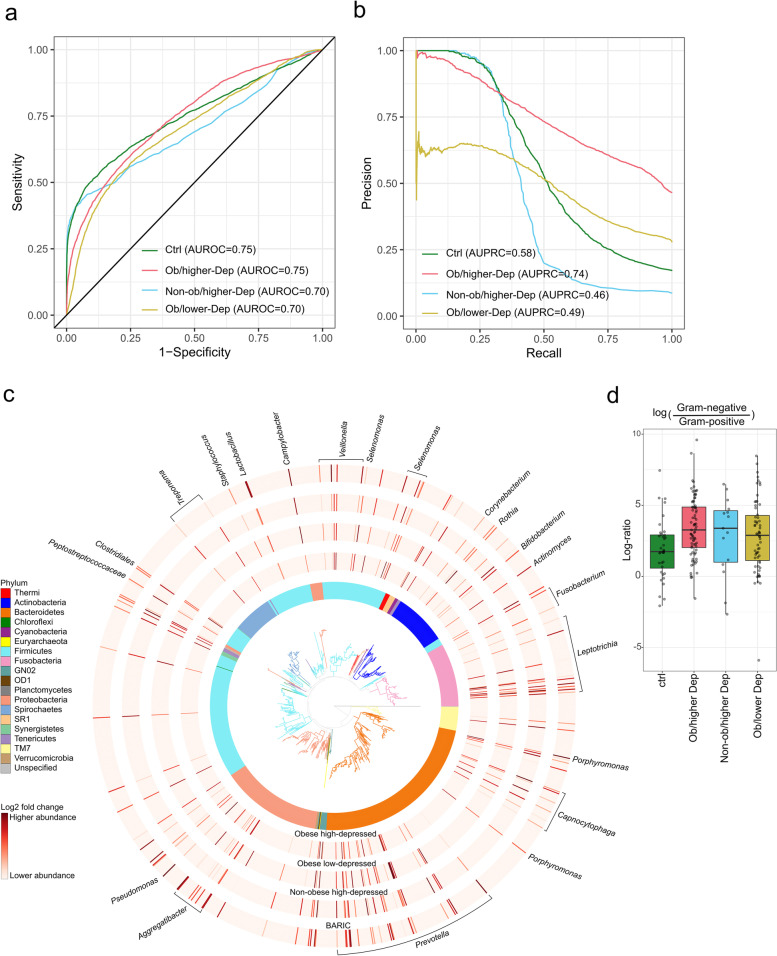
Fig. 2.
Oral microbiota is distinctly impacted by the host status in co-occurring obesity-depressive status. a Receiver operating characteristic curves (AUROC) illustrating classification accuracy of the random forest model across all groups (i.e. controls, Ob/lower Dep, Non-ob/higher-Dep, Ob/higher-Dep). b Area under precision recall curves (AUPRC) illustrating performance of the random forest model across all groups. c Phylogenetic distribution of the most differentially ranked taxa across the groups. Branches of the de novo phylogenetic tree and the innermost ring are colored by phyla. Each barplot layer represents log-fold change abundances of taxa within the group in comparison to the healthy controls i.e. Non-ob/lower-Dep. A multinomial regression model was employed for regressing log-fold change abundances against BARIC values. d Log-fold change abundances of Gram-negative microbes relative to Gram-positive microbes across host phenotypes

