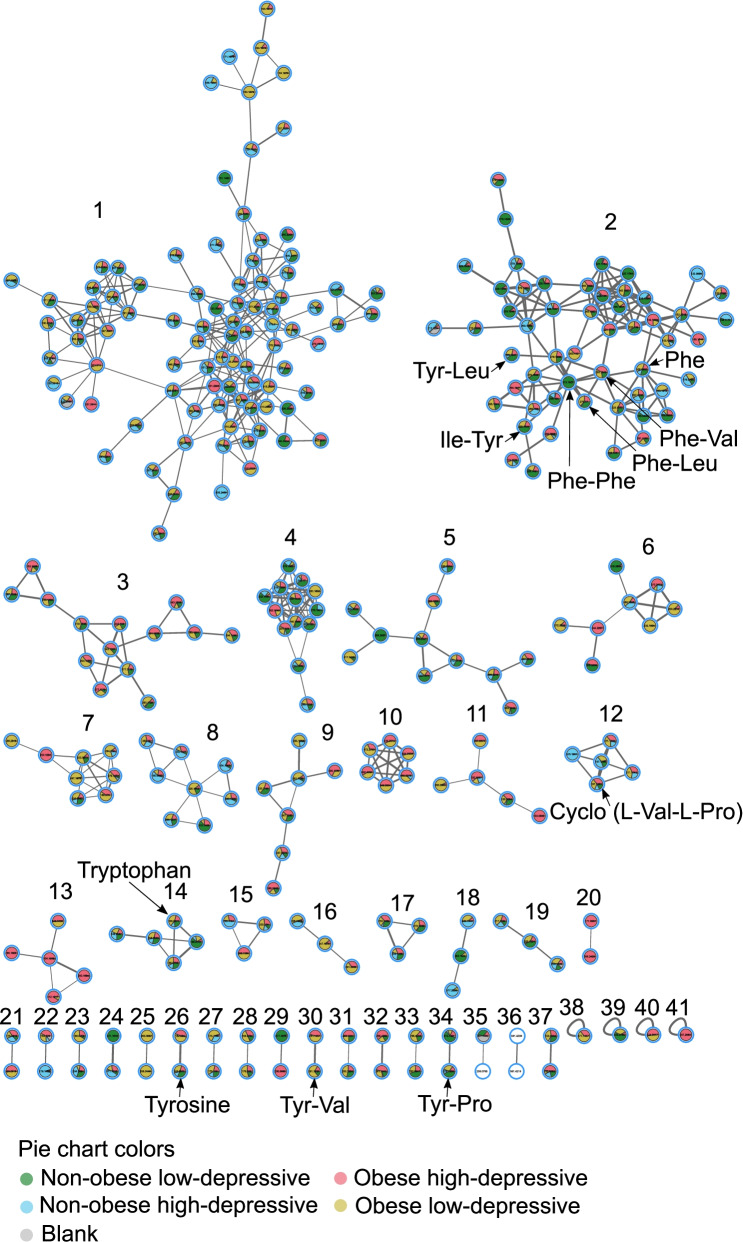
Fig. 3.
Feature-based molecular network of the ions detected in salivary metabolomes of obese-depressive group. The molecular network was generated by 293 nodes with 41 molecular clusters, which are sub-networks of a larger network generated via Global Natural Products Social Molecular Networking (GNPS). Nodes (small circles with m/z values) represent unique tandem mass spectrometry (MS/MS) consensus spectra and edges (lines) drawn between the nodes correspond to similarity (cosine score) between MS/MS fragmentation. Annotation is performed by MS/MS spectral library matching in GNPS platform. Pie charts within the individual nodes qualitatively represent specific ion presence across groups: non-obese and non-depressive, obese, depressive, and both obese and depressive symptom groups, as well as blank samples. Molecular clusters 2, 3, 4, 5, 9, 17, 19, 30 and 34 represent structural diversity of dipeptides. Molecular clusters 2, 14 and 26 represent aromatic amino acids tryptophan, tyrosine and phenylalanine

