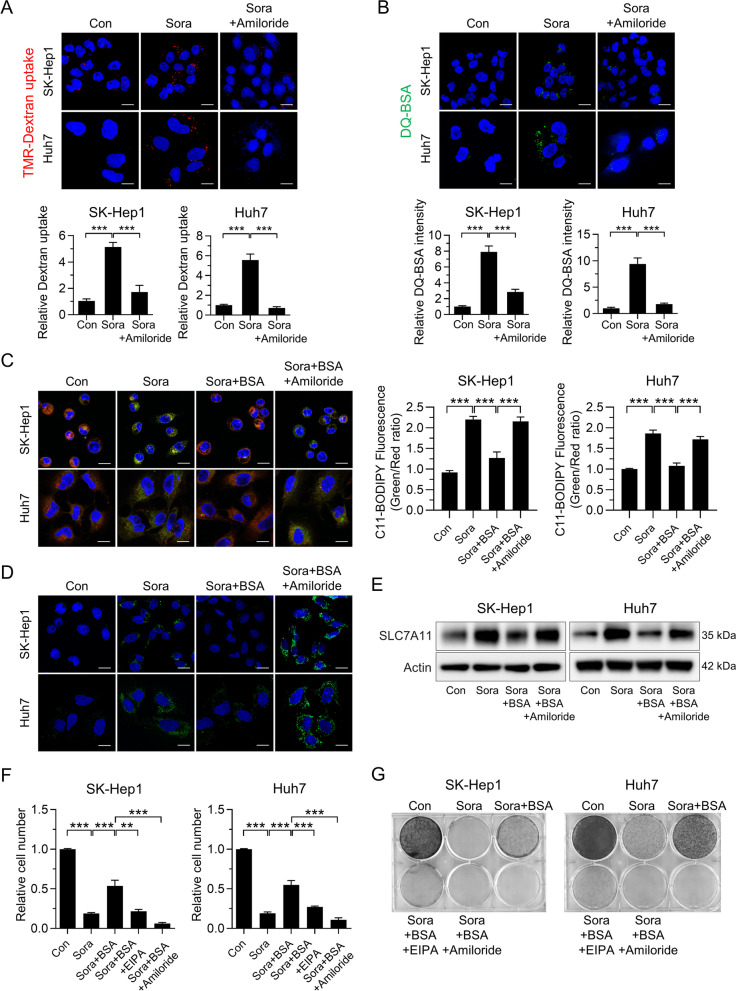
Fig. 4.
Inhibition of macropinocytosis increases sorafenib-induced ferroptosis in HCC. A Representative images of macropinosomes (red) in sorafenib-treated SK-Hep1 and Huh7 cells in the presence or absence of amiloride (upper panel). Quantification of macropinosomes in cells (lower panel). B Representative images of DQ-BSA fluorescence (green) in sorafenib-treated SK-Hep1 and Huh7 cells in the presence or absence of amiloride (upper panel). Quantification of DQ-BSA fluorescence in cells (lower panel). C Representative images of C11-BODIPY in SK-Hep1 and Huh7 cells treated with sorafenib, either alone or in combination with BSA and/or amiloride (left panel). Quantification of C11-BODIPY fluorescence in cells (right panel). D Immunofluorescence of 4-HNE staining in SK-Hep1 and Huh7 cells treated with sorafenib, either alone or in combination with BSA and/or amiloride (green). E Level of SLC7A11 in SK-Hep1 and Huh7 cells treated with sorafenib, either alone or in combination with BSA and/or amiloride. F Relative number of SK-Hep1 and Huh7 cells treated for 48 h with sorafenib, either alone or in combination with BSA, EIPA, and/or amiloride. G Clonogenic assay of SK-Hep1 and Huh7 cells treated for 7 days with sorafenib, either alone or in combination with BSA, EIPA, and/or amiloride. Data are normalized against values measured in vehicle-treated cells (Con) and expressed as the mean ± SEM of at least three independent experiments. Scale bar, 20 µm. **p < 0.01, and ***p < 0.001

