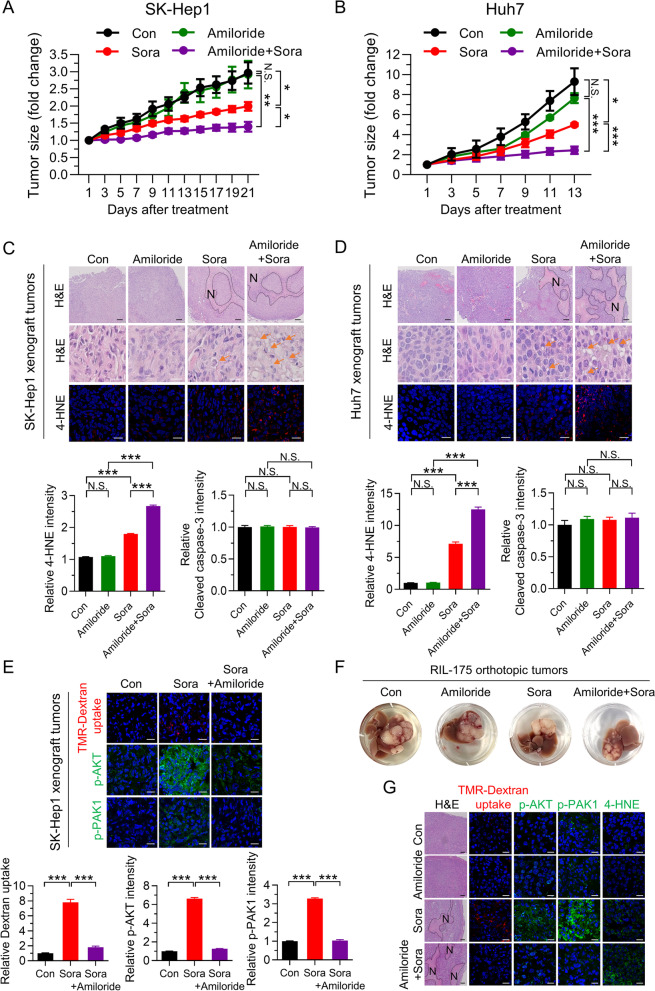
Fig. 5.
Inhibition of macropinocytosis by amiloride augments sorafenib-induced inhibition of tumor growth. (A and B) Tumor growth curves. (C and D) Hematoxylin and eosin (H&E) staining and immunofluorescence staining with anti-4-HNE (scale bar, 20 µm) (upper panel), and quantification of immunofluorescence tissue staining with anti-4-HNE and cleaved caspase-3 (See Fig. S5E and F) (lower panel) (n = 5 per group). Hashed lines and arrows indicate regional necrosis (N) and lipid droplet formation, respectively. (E) Representative images of macropinosomes and immunofluorescence staining for anti-phosphorylated AKT and PAK1 in sections of SK-Hep1 xenografted tumor tissue (upper panel). Quantification of macropinosomes, phosphorylated AKT and PAK1 fluorescence in tumor tissues (lower panel) (n = 3 per group). (F) Representative gross images of orthotopic RIL-175 tumor tissues from 57BL/6 mice after drug treatments (n = 6–8 per group). G H&E staining (scale bar, 150 µm), representative images of macropinosomes, phosphorylated AKT and PAK1, and 4-HNE staining (scale bar, 20 µm) in sections of RIL-175-orthotophic tumor tissues. Hashed lines indicate regional necrosis (N). Data are normalized against values measured in vehicle-treated tumors (Con) and expressed as the mean ± SEM. Black scale bar, 150 µm; White scale bar, 20 µm. N.S., not significant; *p < 0.05, ** p < 0.01, and *** p < 0.001

