Figure 2.
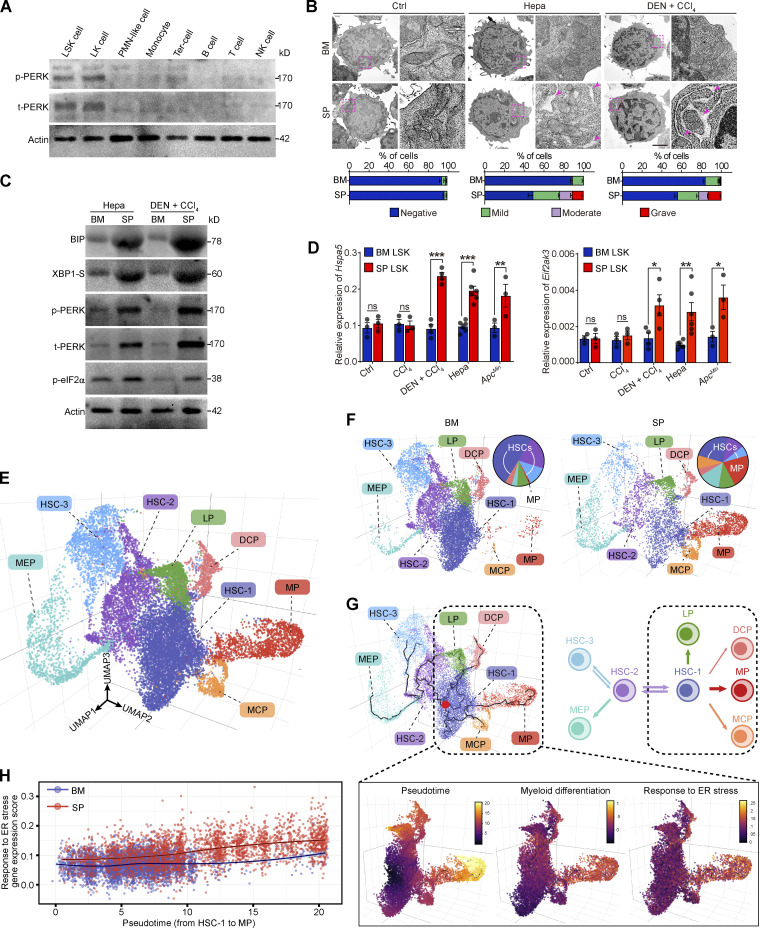
Robust ER stress response with PERK activation is concomitant with early myeloid commitment in splenic HSPCs. (A) IB analysis of PERK expression in different splenic subsets from Hepa mice. t, total. (B) Representative microphotographs of LSK cell morphology and the proportions of cells with different degrees of ER dilation (lower panel, n = 2 samples per group, with cells pooled from 25–80 mice). Arrows denote dilated ER. Scale bar, 2 μm. (C) IB analysis of BIP, XBP1-S, PERK, and p-eIF2α levels in BM and spleen (SP) LSK cells from Hepa mice. (D) Hspa5 and Eif2ak3 mRNA expression in BM and SP LSK cells from control, CCl4-treated, CCl4 + DEN–treated, Hepa, and ApcMin mice (n = 3–6 samples per group, with cells pooled from three to five mice). Values are presented relative to Actb mRNA expression. (E) 3D UMAP graph of single LSK cells from Hepa mice. LP, lymphoid-biased progenitor; DCP, dendritic cell progenitor; MCP, mast cell progenitor. (F) Proportions of eight clusters in BM and SP LSK cells. (G) Single-cell trajectory analysis (upper panel) of LSK cells. A root node (red dot) in the HSC-1 cluster was defined as the starting point of differentiation. (H) Correlation between genes associated with the ER stress response and genes involved in myeloid commitment. Error bars indicate the means ± SEM. Statistics: Two-way ANOVA corrected by Bonferroni’s test. *, P < 0.05; **, P < 0.01; ***, P < 0.001. Data are from one experiment with cells pooled from 15 mice (E–H) or two independent experiments (B and D) or are representative of two experiments with cells pooled from 5 to 10 mice (A and C). Source data are available for this figure: SourceDataF2.

