Figure 3.
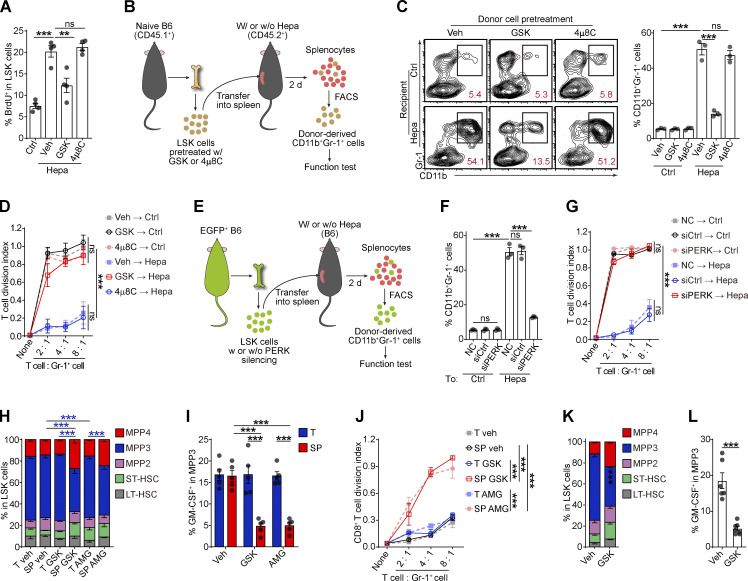
PERK activation promotes myelopoiesis in splenic LSK cells. (A) Effects of 4μ8C and GSK on splenic LSK cell proliferation in vivo (n = 4 mice per group). Veh, vehicle. (B) Cartoon depicting the adoptive transfer assay. (C) Percentages of donor-derived CD11b+Gr-1+ myeloid cells. The numbers in the flow cytometry plots indicate the proportions of gated cells. (D) Suppressive activity of donor-derived CD11b+Gr-1+ myeloid descendants. (E) Cartoon depicting the adoptive transfer assay. (F) Percentages of donor-derived CD11b+Gr-1+ myeloid cells, as determined by flow cytometry. (G) Suppressive activity of donor-derived CD11b+Gr-1+ myeloid descendants. (H–J) Proportions of subsets in splenic LSK cells (H), percentage of GM-CSF+ cells in splenic MPP3 cells (I), and suppressive activity of Gr-1+ myeloid descendants of splenic LSK cells (J) from Hepa mice receiving the indicated treatments as described in Fig. 1 A (n = 5 mice per group). (K and L) Proportions of HSPC subsets in splenic LSK cells (K) and percentage of GM-CSF+ cells in MPP3 (L) from Hepa mice with the indicated oral treatments (Veh, n = 6 mice; GSK, n = 7 mice). Error bars indicate the means ± SEM. Statistics: Student’s t test (L); one-way ANOVA corrected by Tukey’s test (A, C, and F); two-way ANOVA corrected by Bonferroni’s test (K) or Tukey’s test (D and G–J). **, P < 0.01; ***, P < 0.001. Data are from two independent experiments (A, H, I, K, and L) or three independent experiments (C, D, F, G, and J, n = 3 samples per group, with cells pooled from three mice).

