Figure 4.
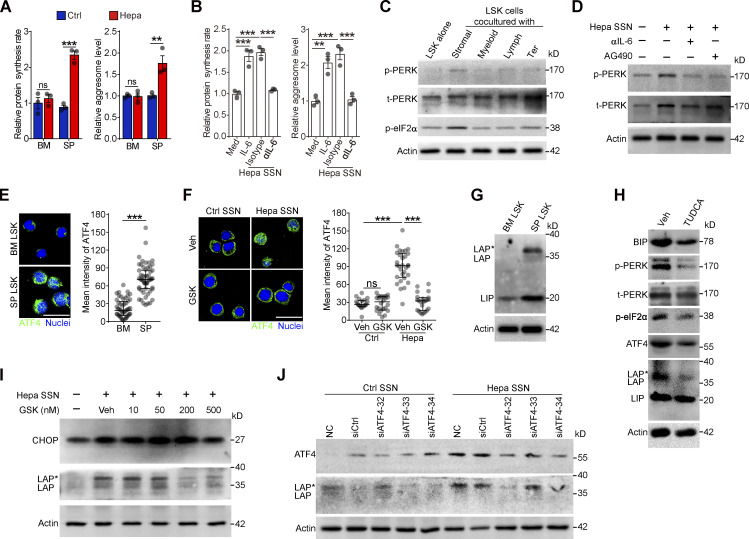
Tumor-associated splenic stroma induces ER stress responses in HSPCs and activates PERK–ATF4–C/EBPβ signaling. (A and B) Protein synthesis rates and levels of protein aggregates in BM and spleen (SP) LSK cells from control and Hepa mice (A, n = 3 mice per group) or in LSK cells cultured with Hepa mouse-derived SSN (Hepa SSN; B). (C) IB analysis of PERK and p-eIF2α levels in LSK cells cocultured with the indicated splenic cell types. (D) Effects of Hepa SSN, anti–IL-6 neutralizing antibody (αIL-6), and STAT3 inhibitor (AG490) on PERK expression in LSK cells. (E and F) Expression and distribution of ATF4 in LSK cells from Hepa mice (E) or in cultured LSK cells with the indicated treatments (F). Scale bar, 25 μm. Veh, vehicle. (G) IB analysis of the expression of the C/EBPβ isoforms (LAP*, LAP, and LIP) in BM and splenic LSK cells from Hepa mice. (H) IB analysis of ER stress response signaling in splenic LSK cells from Hepa mice. Mice were treated with TUDCA or vehicle via spleen-targeted micro-osmotic pump delivery. (I) IB analysis of CHOP and C/EBPβ isoforms in LSK cells under the indicated conditions. (J) IB analysis of ATF4 and C/EBPβ isoforms in LSK cells with indicated treatments. Error bars indicate the means ± SEM (A and B) or medians and IQRs (E and F). Statistics: Mann–Whitney U test (E and F); one-way ANOVA corrected by Tukey’s test (B), two-way ANOVA corrected by Bonferroni’s test (A). **, P < 0.01; ***, P < 0.001. In E and F, dots are representative of 20–50 cells from two samples per group. Data are from two independent experiments (A) or three independent experiments (n = 3 samples) with cells pooled from three mice (B, E, and F) or are representative of two independent experiments (C, D, and G–J). t, total. Source data are available for this figure: SourceDataF4.

