Figure 8.
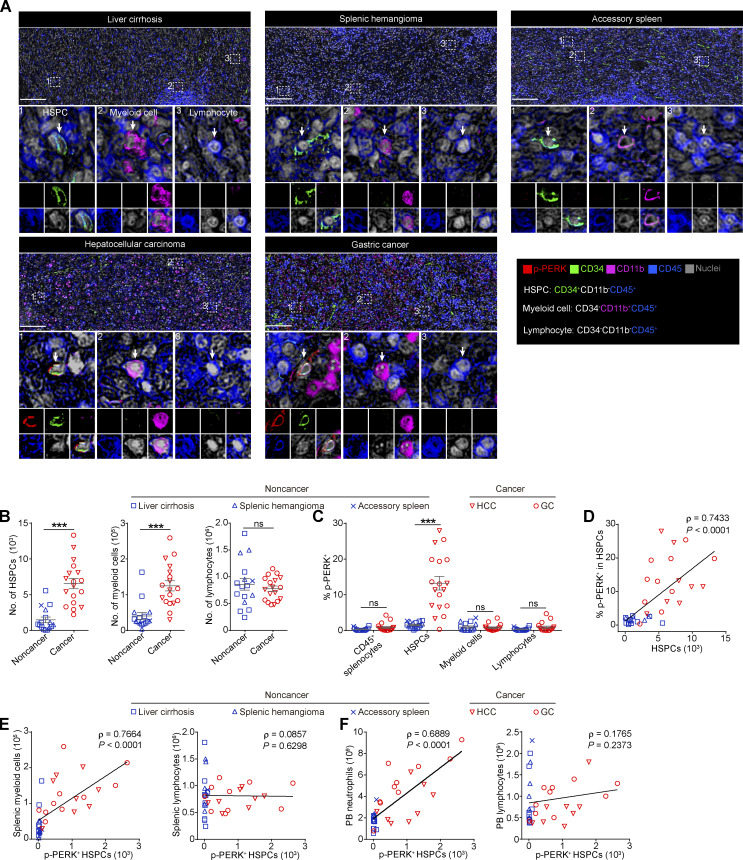
Upregulated p-PERK expression in splenic HSPCs is correlated with extramedullary myelopoiesis in cancer patients. (A) Representative mIHC images of p-PERK expression in CD34+CD11b−CD45+ HSPCs (1), CD34−CD11b+CD45+ myeloid cells (2), and CD34−CD11b−CD45+ lymphocytes (3) in spleen tissues from noncancer and cancer patients. Scale bar, 200 μm. (B) Densities of HSPCs, myeloid cells, and lymphocytes in splenic specimens from noncancer and cancer patients. Splenocyte densities were calculated as cell numbers per cm2 splenic red pulp. (C) Percentage of p-PERK+ cells in different cell populations. (D) Correlation between p-PERK expression in HSPCs and the HSPC density in the spleen. (E) Correlation between the densities of splenic p-PERK+ HSPCs and splenic myeloid cells or lymphocytes. (F) Correlation between the splenic p-PERK+ HSPC density and neutrophil or lymphocyte number per liter of peripheral blood (PB) from patients. Error bars indicate means ± SEM. Statistics: Mann–Whitney U test (B and C); Spearman’s rank correlation analysis and linear regression analysis (D–F). ***, P < 0.001. Data are from four independent experiments (accessory spleen, n = 1; splenic hemangioma, n = 5; liver cirrhosis, n = 8; HCC, n = 10; GC, n = 10).

