Figure S1.
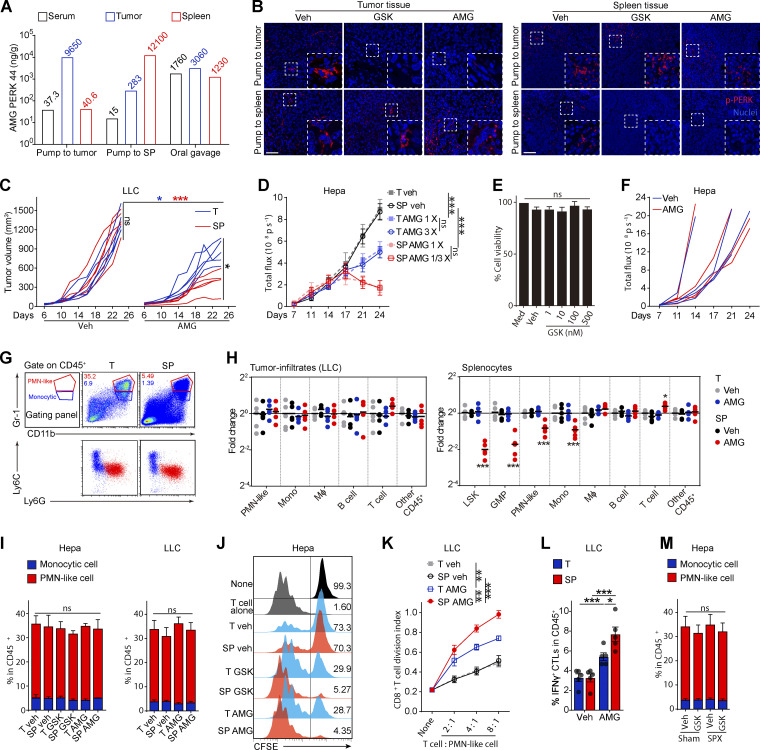
Pharmacological splenic-targeted PERK blockade reshapes the TME and inhibits tumor progression. (A) Concentrations of AMG in the indicated organs of Hepa mice after pump-mediated delivery of AMG into the tumor (T) or spleen (SP) or oral gavage of AMG, as determined by UPLC–MS/MS; related to Fig. 1 A. (B) p-PERK levels in the tumor and spleen tissues of the Hepa-mice, as determined by immunofluorescence staining; scale bar, 25 μm; related to Fig. 1 A. Veh, vehicle. (C) Tumor burden in LLC mice (n = 5 mice per group) with pump delivery of veh or AMG into the tumor (T) or spleen (SP). (D) Tumor burden in Hepa mice with pump delivery of different doses of AMG to the tumor (T) or spleen (SP), as determined by the interactive video information system system: 1/3× dose, 7 μg/d; 1× dose, 21 μg/d; 3× dose, 63 μg/d. (E) Alamar blue assay was used to analyze the viability of Hepa1-6 cells cultured with GSK (GSK, n = 3 samples). (F) Tumor burden in orthotopic Hepa NOD-SCID mice treated with vehicle or AMG (n = 4 mice per group) by oral gavage. (G) Differential expression of Ly6G and Ly6C on CD11b+Gr-1high PMN-like cells (PMN-MDSCs) and CD11b+Gr-1int monocytic cells (M-MDSCs) in the tumor and spleen from Hepa mice. The numbers in the flow cytometry plots indicate the proportions of gated cells. (H) Fold-changes in tumor infiltrate (left) or splenocyte (right) frequencies determined by flow cytometry. Values are presented relative to the indicated cell percentages in the T-veh group (n = 5 mice per group). (I) Percentages of PMN-like cells and monocytic cells in the CD45+ tumor-infiltrating cells from Hepa and LLC mice (n = 5 mice per group). (J) Proliferation assessed by flow cytometry in CFSE-labeled T cells cocultured with CD11b+Gr-1high PMN-like cells (4:1 ratio); related to Fig. 1 D. (K) Suppressive activity of tumor-infiltrating PMN-like cells on T cell proliferation (n = 5 LLC mice per group); none, without αCD3/28 antibody stimulation. (L) Percentage of tumor-infiltrating IFN-γ+ CTLs from LLC mice (n = 5 mice per group). (M) Percentages of PMN-like cells and monocytic cells among the CD45+ tumor-infiltrating cells from Hepa mice receiving the indicated treatment (n = 5–7 mice per group). Error bars indicate the means ± SEM. Statistics: One-way ANOVA corrected with Tukey’s test (E and L); two-way ANOVA corrected by Dunnett’s test (H) or Tukey’s test (C, D, I, K, and M). *, P < 0.05; **, P < 0.01; ***, P < 0.001. Data are from one experiment with organs pooled from three to five mice (A), two independent experiments (C, D, F, and H–M), or three independent experiments (E) or are representative of three independent experiments (B and G).

