Figure S2.
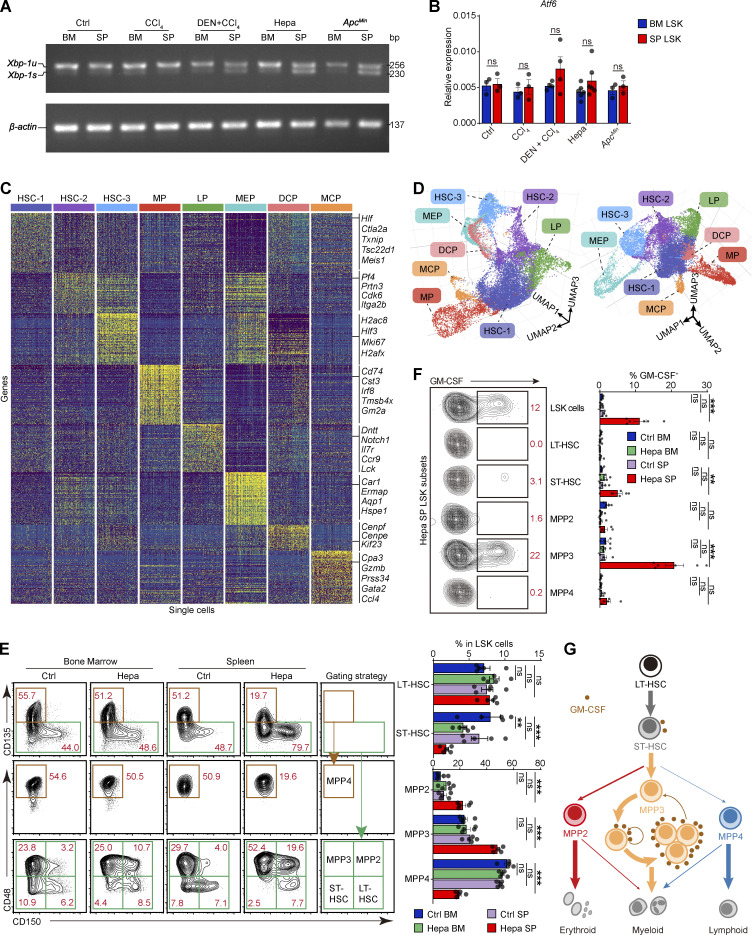
Robust ER stress response is concomitant with early myeloid commitment in splenic HSPCs. (A) Xbp-1 splicing in LSK cells from the indicated mice as determined by RT-PCR. u, unspliced. (B) Atf6 expression levels in BM and SP LSK cells from the indicated mice; related to Fig. 2 D (n = 3–6 samples, with cells pooled from three to five mice). (C) Single-cell expression profiles of each LSK cell cluster from Hepa mice. From each cluster, 200 randomly sampled cells are shown. LP, lymphoid-biased progenitor; DCP, dendritic cell progenitor; MCP, mast cell progenitor. (D) Two visual perspectives of the 3D UMAP dimensionality reduction in addition to the one shown in Fig. 2 E. (E) Phenotypes and proportions of HSPC subsets in BM and spleen LSK cells from control and Hepa mice, as determined by flow cytometry (n = 5 mice per group). LT, long term; ST, short term. Numbers in the plots indicate the proportions of gated cells in the LSK cells. (F) Percentages of GM-CSF–expressing cells in each LSK cell subpopulation, as determined by flow cytometry (Ctrl, n = 5 mice; Hepa, n = 6 mice). Numbers in the plots indicate the proportions of gated cells in the plot. (G) Schematic illustrating the lineage commitment and differentiation of LSK cell subsets. A model of endogenous GM-CSF–driven, positive self-feedback–based MPP3 expansion is shown. Error bars indicate the mean ± SEM. Statistics: Two-way ANOVA corrected by Bonferroni’s test (B) or Dunnett’s test (E and F). **, P < 0.01; ***, P < 0.001. Data are from one experiment, with cells pooled from 15 mice (C and D), or two independent experiments (B, E, and F) or are representative of two independent experiments (A). Source data are available for this figure: SourceDataFS2.

