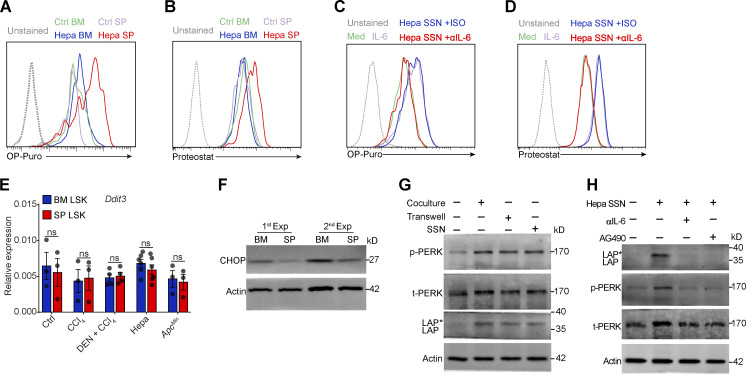
Figure S4.
Tumor-associated splenic stroma reprograms HSPCs by triggering PERK–ATF4–CEBPβ signaling activation. (A and B) Histogram of FACS results; related to Fig. 4 A. (C and D) Histogram of FACS results; related to Fig. 4 B. (E) Ddit3 (CHOP) mRNA levels in BM and splenic LSK cells from ctrl, CCl4, CCl4 + DEN, Hepa, and ApcMin mice, as determined by a TaqMan gene expression assay (n = 3–6 samples, with cells pooled from three to five mice). Values are presented relative to Actb mRNA expression. (F) IB analysis of CHOP expression in BM and splenic LSK cells from Hepa mice. (G) IB analysis of the levels of the PERK and C/EBPβ isoforms in LSK cells exposed to Hepa SSN. (H) IB analysis of PERK and C/EBPβ isoform expression in LSK cells in the indicated system. Error bars indicate the mean ± SEM. Statistics: Two-way ANOVA corrected by Bonferroni’s test (E). Data are from two independent experiments (A–E) or are representative of two independent experiments (F–H). SP, spleen; t, total. Source data are available for this figure: SourceDataFS4.

