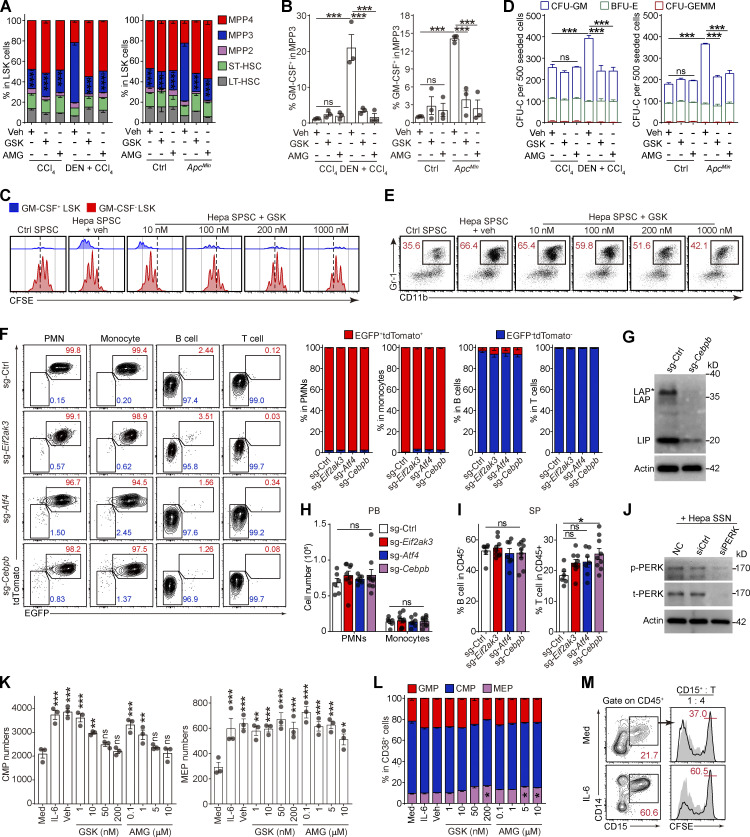
Figure S5.
PERK–ATF4–CEBPβ signaling reprograms splenic LSK cells to support tumor-associated myelopoiesis in the spleen. (A, B, and D) Naive BM LSK cells were pretreated with vehicle (0.1% DMSO) or PERK inhibitors (GSK, 250 nM; AMG, 5 μM) before exposure to SSNs from control, CCl4, DEN + CCl4, or ApcMin mice with the indicated supplements. After 4 d of culture, the proportions of HSPC subsets (A), percentages of GM-CSF–expressing cells in MPP3 (B), and CFU-C activity (D) were determined (n = 3 samples, with cells pooled from three mice each). Veh, vehicle. (C) Proliferation of GM-CSF+ and GM-CSF− LSK cells cocultured with Hepa mouse splenic stromal cells (SPSCs), as measured using a CFSE assay. (E) Effect of GSK on the Hepa SPSC-induced frequency of CD11b+Gr-1+ myeloid descendants. Numbers in the plots indicate the proportions of gated cells in the LSK cells. (F) Percentages of donor-derived (EGFP+tdTomato+) or host/rescue-derived (EGFP−tdTomato−) cells in CD11b+Gr-1 highLy6ClowLy6G+ PMNs, CD11b+Gr-1intLy6ChighLy6G− monocytes, B220+ B cells, and CD3+ T cells in the peripheral blood (PB) of recipient mice bearing Hepa tumors, as determined by flow cytometry. The numbers in the flow cytometry plots indicate the proportions of gated cells. (G) IB analysis of the expression of CEBP isoforms (LAP*, LAP, and LIP) in splenic LSK cells from control or Cebpb-KO HSPC transplanted mice. (H) Numbers of PMNs or monocytes per milliliter of peripheral blood (PB) from HSPC-transplanted mice. (I) Percentage of B220+ B cells or CD3+ T cells in the CD45+ splenocytes of HSPC transplanted mice. (J) IB analysis of PERK expression in LSK cells exposed to Hepa SSN with or without PERK silencing; related to Fig. 6, D and E. (K) Numbers of CMPs and MEPs generated by 500 lin−CD34+CD38− HSPCs after 72 h of culture; related to Fig. 7 F (n = 3 samples). (L) The proportions of GMPs, CMPs, and MEPs among lin−CD34+CD38+ HSPCs after 72 h of culture; related to Fig. 7 F (n = 3 samples). (M) Phenotype (left) and suppressive activity (right) of CD15+ descendant cells generated from expanded CD34+ CB-HSPCs. Numbers in the plots indicate the proportions of gated cells. Error bars indicate mean ± SEM. Statistics: One-way ANOVA corrected by Dunnett’s test (B, I, and K); two-way ANOVA corrected by Dunnett’s (A, H, and L) or Tukey’s (D) test. *, P < 0.05; **, P < 0.01; ***, P < 0.001. Data are from two independent experiments (F, H, and I, sg-Ctrl, n = 6 mice; sg-Eif2ak3, n = 9 mice; sg-Atf4, n = 7 mice; sg-Cebpb, n = 9 mice) or three independent experiments (A, B, D, K, and M) or are representative of two to three independent experiments (C, E, G, and M). LT, long term; ST, short term. Source data are available for this figure: SourceDataFS5.

