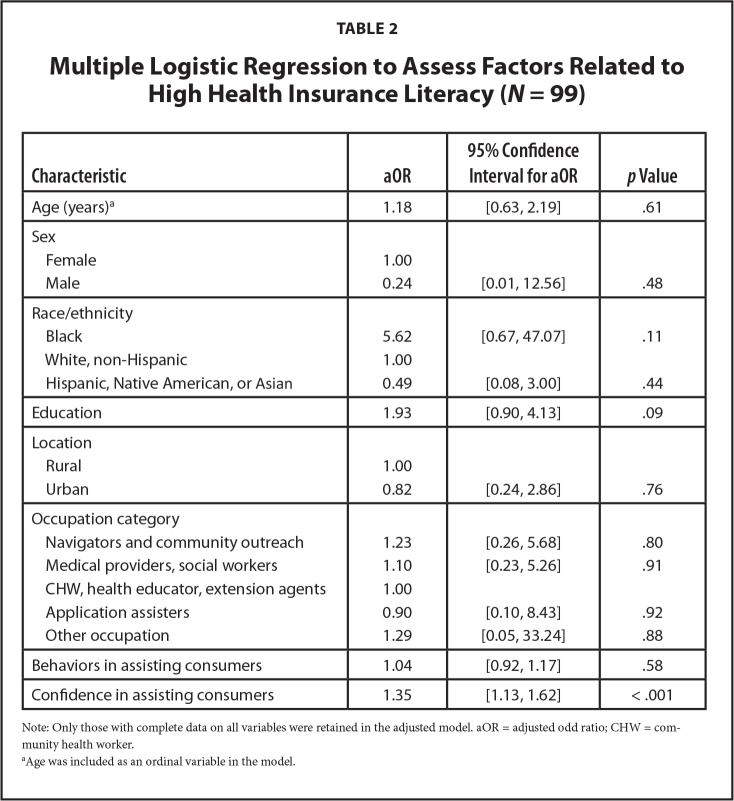
Table 2.
Multiple Logistic Regression to Assess Factors Related to High Health Insurance Literacy (N = 99)
| Characteristic | aOR | 95% Confidence Interval for aOR | p Value |
|---|---|---|---|
|
| |||
| Age (years)a | 1.18 | [0.63, 2.19] | .61 |
|
| |||
| Sex | |||
| Female | 1.00 | ||
| Male | 0.24 | [0.01, 12.56] | .48 |
|
| |||
| Race/ethnicity | |||
| Black | 5.62 | [0.67, 47.07] | .11 |
| White, non-Hispanic | 1.00 | ||
| Hispanic, Native American, or Asian | 0.49 | [0.08, 3.00] | .44 |
|
| |||
| Education | 1.93 | [0.90, 4.13] | .09 |
|
| |||
| Location | |||
| Rural | 1.00 | ||
| Urban | 0.82 | [0.24, 2.86] | .76 |
|
| |||
| Occupation category | |||
| Navigators and community outreach | 1.23 | [0.26, 5.68] | .80 |
| Medical providers, social workers | 1.10 | [0.23, 5.26] | .91 |
| CHW, health educator, extension agents | 1.00 | ||
| Application assisters | 0.90 | [0.10, 8.43] | .92 |
| Other occupation | 1.29 | [0.05, 33.24] | .88 |
|
| |||
| Behaviors in assisting consumers | 1.04 | [0.92, 1.17] | .58 |
|
| |||
| Confidence in assisting consumers | 1.35 | [1.13, 1.62] | < .001 |
Note: Only those with complete data on all variables were retained in the adjusted model. aOR = adjusted odd ratio; CHW = community health worker.
Age was included as an ordinal variable in the model.

