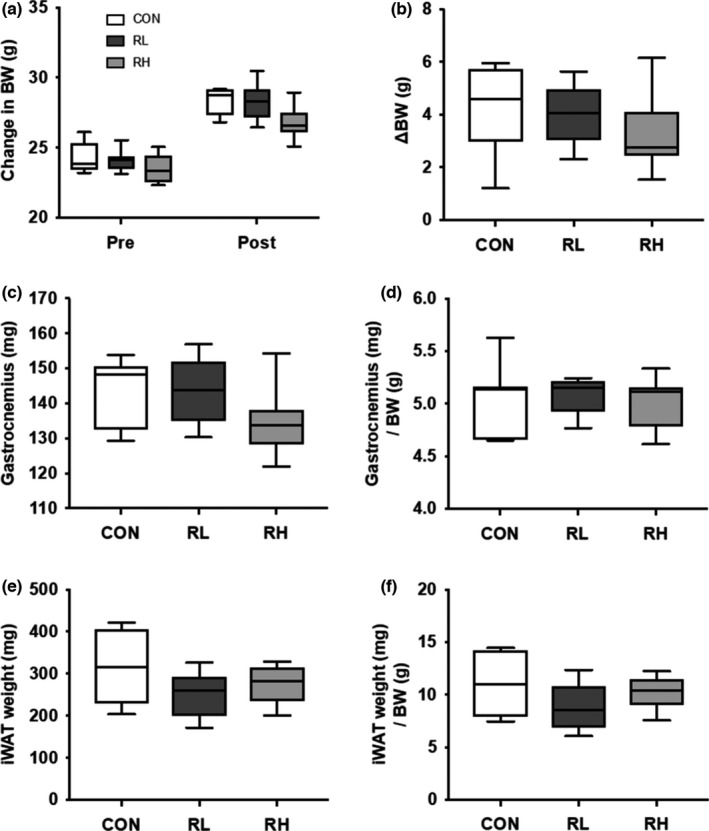
FIGURE 2.

Effect of high‐ or low‐intensity running on BW, gastrocnemius wet weight, and iWAT wet weight. Pre and post training BW (A), change in BW at pre and post training (B), gastrocnemius muscle wet weight (C), gastrocnemius muscle wet weight per BW (D), iWAT wet weight (E) and iWAT wet weight per BW (F), and were measured after 4 weeks of running. CON, control; RL, low intensity running; RH, high intensity running. Data are presented as means + SD
