FIGURE 6.

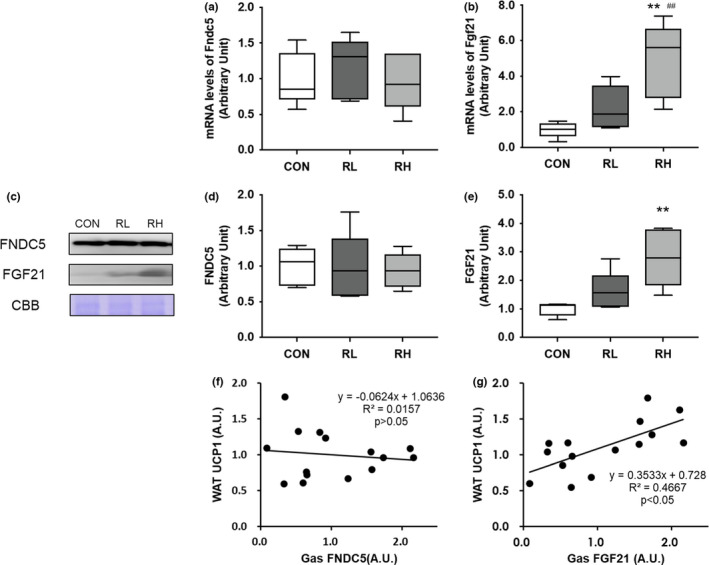
Effects of high‐ or low‐intensity running on the expression of FGF21 and FNDC5 in the gastrocnemius muscle. Gene expressions of Fndc5 (A), Fgf21 (B) in the iWAT after 4 weeks of exercise training were analyzed using RT‐PCR. Representative immunoblots are shown in (C). Expressions of FNDC5 (D) or FGF21 (E) in the gastrocnemius muscle after 4 weeks of training were analyzed using Western blot. The correlation between protein expression of UCP1 in iWAT and the protein expression of FNDC5 (F) or FGF21 (G) in gastrocnemius muscle is displayed. CON, control; RL, low‐intensity running; RH, high‐intensity running. Data are presented as means + SD. **p < 0.01 versus the CON group, ## p < 0.01 versus the RL group
