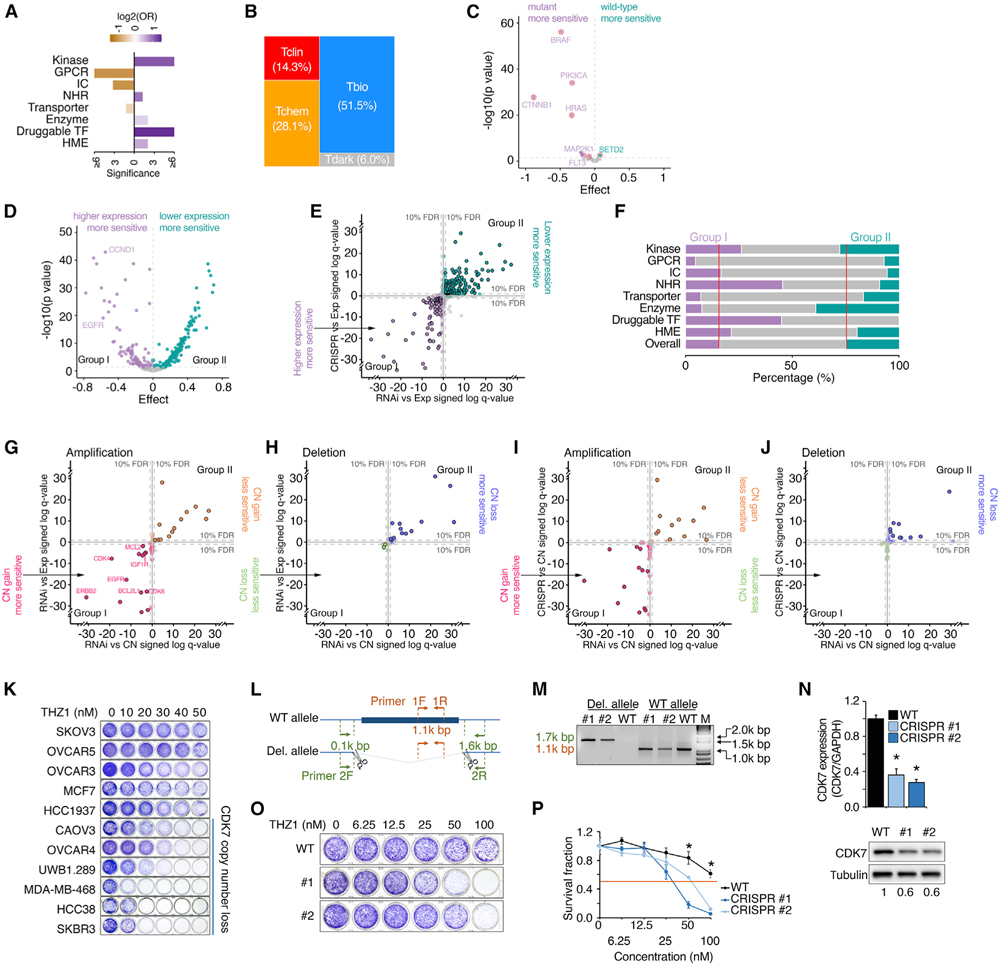
Figure 5. Cancer dependency of PDGs across cancer cell lines.
(A) Bar plot shows enrichment of cancer-dependent PDGs in the corresponding gene families. Cancer-dependent PDGs were defined as common essential or strongly selective in the DepMap project. Purple, enriched; orange, depleted.
(B) Mosaic plots show the distribution of TDL classes among cancer-dependent PDGs.
(C) Volcano plot summarizes correlations between dependency and gene mutation for cancer-dependent PDGs. Each dot represents one cancer-dependent PDG with recurrent mutations. Of the genes whose mutations were significantly correlated with either increased or decreased sensitivity to RNAi knockdown (purple or green, respectively; FDR < 10%), genes with hotspot gain-of-function mutations were highlighted with red circles.
(D) Volcano plot summarizes correlations between dependency and gene expression for cancer-dependent PDGs. At the FDR 10% level, the genes whose higher expression levels were significantly correlated with either increased or decreased sensitivity to RNAi knockdown were categorized as group I (purple) or group II (green), respectively.
(E) Correlation of gene dependency (x axis, RNAi; y axis, CRISPR) with RNA expression for cancer-dependent PDGs. Purple or green, significant in either RNAi or CRISPR; borders, significant in both analyses; gray, not significant. Coordinates: “signed log q values” by linear regression; negative/positive sign: higher gene expression associated with increased/decreased sensitivity.
(F) Percentage of group I (purple) and group II (green) genes in each gene family.
(G and H) Correlation of gene dependency (RNAi) with copy number (x axis) and RNA expression (y axis) for amplified PDGs (G) and deleted PDGs (H). Points in pink/green or orange/blue indicate significance in either copy number or expression analysis; points within borders indicate significance in both analyses; points in gray indicate non-significance. Coordinates: “signed log q values” by linear regression; negative sign: high gene expression or copy number associated with increased sensitivity; positive sign: high gene expression or copy number associated with decreased sensitivity; distance from 0: q value; FDR: false discovery rate.
(I and J) Correlation of gene dependency (x axis, RNAi; y axis, CRISPR) with copy number for cancer-dependent amplified PDGs (I) and deleted PDGs (J). Each dot represents one cancer-dependent PDG with recurrent copy number alterations (G score for amplification >0.61 or G score for deletion >0.66). Pink/green or orange/blue, significant in either RNAi or CRISPR analysis; borders, significant in both analyses; gray, not significant. Coordinates: “signed log q values” by linear regression; negative/positive sign: higher copy number associated with increased/decreased sensitivity.
(K) Cancer cell lines with hemizygous losses of CDK7 were sensitive to CDK7i. Representative colony formation assay of a panel of cancer cell lines treated with a series of dosages of THZ1 for 6 days. CDK7 copy number status of each line was assessed by GISTIC.
(L) Manipulation of CDK7 copy number by CRISPR-Cas9.
(M) PCR results of wild-type OVCAR5 and two CDK7 hemizygously deleted clones. Bands of 1.7 and 1.1 kb indicate CDK7-deleted and wild-type alleles, respectively.
(N) qRT-PCR analysis (top) and western blot (bottom) show CDK7 RNA and protein expression among the indicated cells, respectively.
(O and P) Representative colony formation assay (O) and survival fraction (P) of wild-type OVCAR5 and two CDK7 hemizygously deleted clones treated with a series of dosages of THZ1 for 6 days. All experiments were performed in triplicate. Statistical analysis by Student’s t test, *p < 0.05; n = 3. Error bars represent means ± SD.

