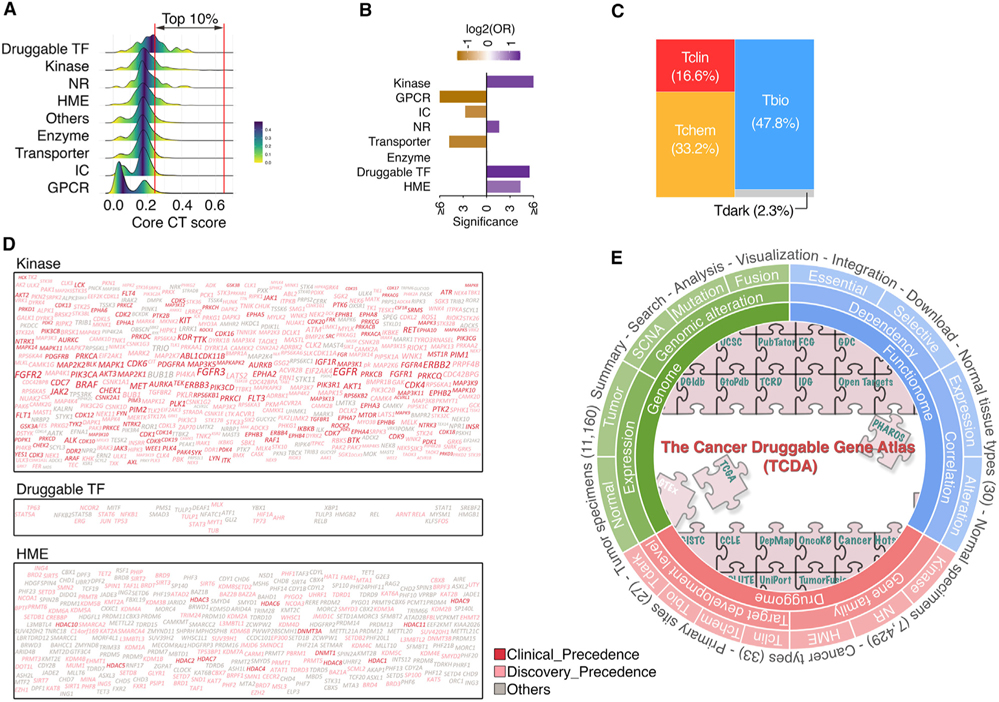
Figure 7. Large and unexplored opportunities for development of anticancer drugs.
(A) Density plots show distribution of core PCDT scores among PDGs stratified by gene families.
(B) Bar plot shows enrichment of PDGs with high core PCDT scores in the corresponding gene families.
(C) Mosaic plots show distribution of TDL classes within PDGs with high core PCDT scores.
(D) Word clouds of the high core PCDT score PDGs in three gene families. Size of fonts: core PCDT score. Color of fonts: target tractability defined by the Open Targets database; red, clinical precedence; pink, discovery precedence; gray, others.
(E) Overview of the TCDA data portal.

