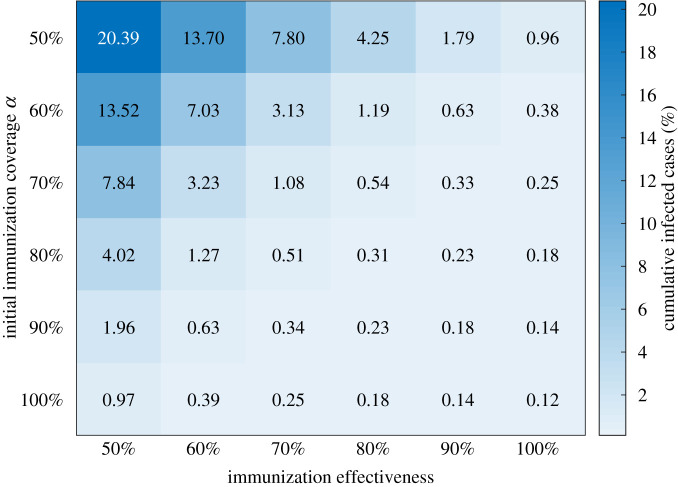
Figure 2.
Heat map showing cumulative infected cases as a function of immunization effectiveness and initial immunization coverage under relaxed NPIs and R0 = 3. The colour code represents the median percentage of cumulative infected cases by the end of the semester. The number of simulation runs is 1000.

