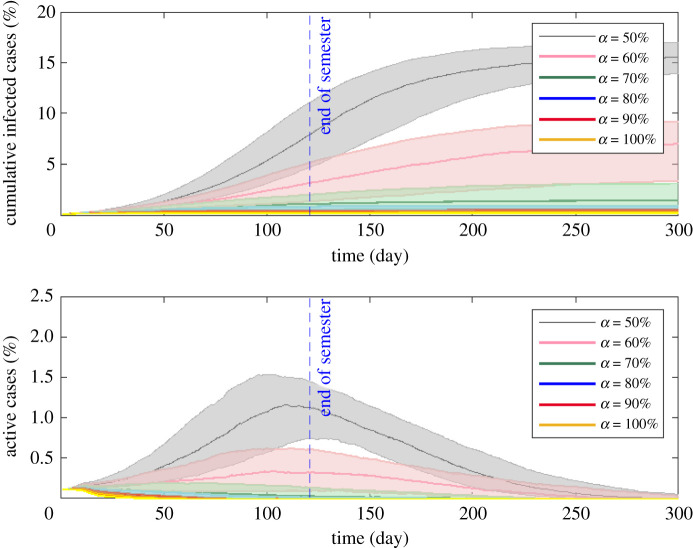
Figure 3.
Effect of initial immunization coverage α on cumulative infected cases and active cases with 70% immunization effectiveness and R0 = 3 under relaxed NPIs. The beginning of the simulation corresponds to the start of the semester, and the vertical dashed blue line indicates the end of the autumn semester. While our main focus is to examine the epidemic dynamics over the coming autumn semester, we provide a relatively complete picture of the epidemic curve up to day 300. The initial immunization coverage α is varied between 50% and 100%, with an interval of 10%. The solid lines show the median percentages of cumulative infected and active cases, and the shaded areas represent the 25th percentile and 75th percentile interquartile range of 1000 simulation runs.

