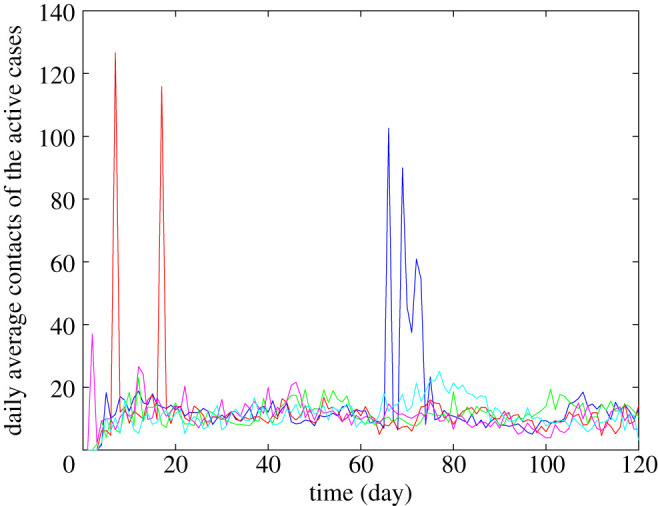
Figure 5.

Average daily contacts of the active cases. The figure depicts the average daily contacts of the active cases for five simulation runs (blue, red, green, magenta and cyan) with the top five cumulative infections among all 1000 simulation runs. The simulation considers relaxed NPIs with 70% immunization effectiveness, α = 80% and R0 = 3.
