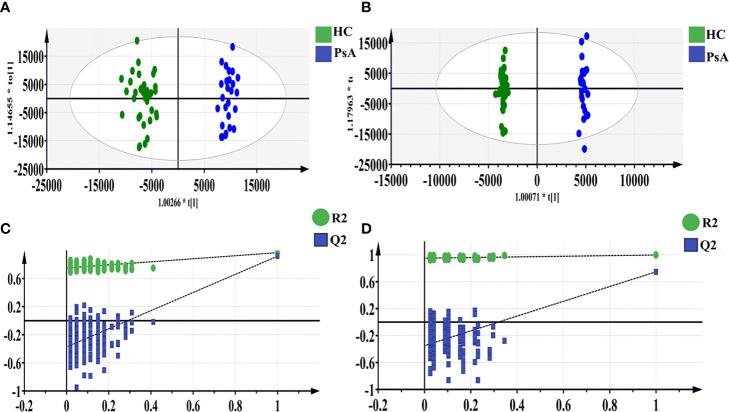
Figure 2.
OPLS-DA score scatter plots of polar extracts between HC group and PsA group in positive (A) and negative ion mode (B). The result of permutation test in positive ion mode (C) and negative ion mode (D). The R2 and Q2 values were R2X (cum) = 0.317, R2Y (cum) = 0.968, Q2 (cum) = 0.918 in positive mode. The R2 and Q2 values were R2X (cum) = 0.362, R2Y (cum) = 0.997, Q2 (cum) = 0.748 in negative mode. The intercept of Q2 of positive and negative ion modes on the y-axis was <0, indicating a valid model.

