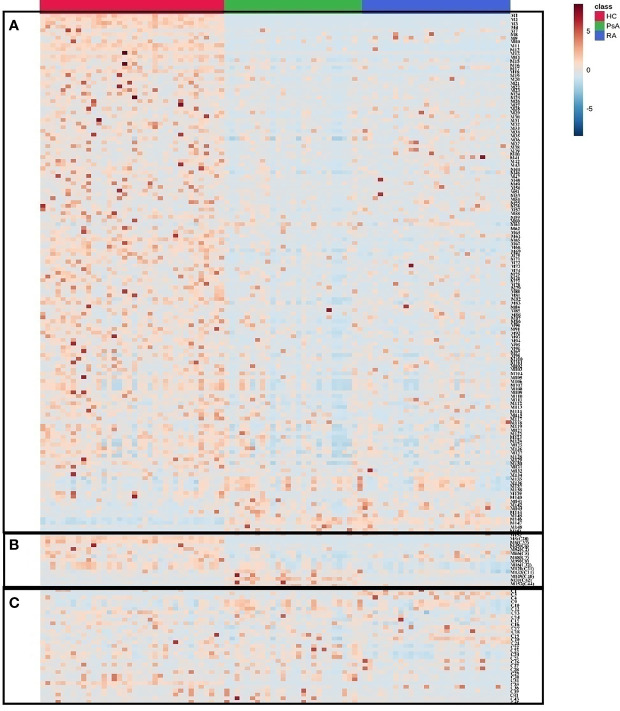
Figure 3.
The heatmap of differential metabolites in HC, PsA and RA groups. Red color indicates high level of metabolites and blue color indicates low level of metabolites. (A) Metabolites distinguishing HC from PsA groups; (B) Metabolites distinguishing PsA from all other groups; (C) Metabolites distinguishing PsA from RA groups.

