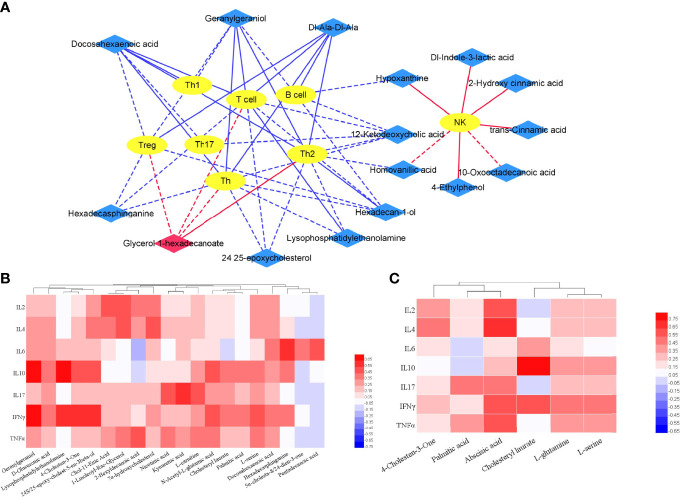
Figure 7.
Correlation of differential metabolites and clinical features. (A) Integrative network of associations reflecting the interactions of differential metabolites (PsA vs HC) and lymphocyte subpopulation via Cytoscape (3.8.2). Network revealed both significant (p <0.01) and suggestive associations (0.01< p <0.05) between differentially abundant metabolites and lymphocyte subpopulation in PsA. Yellow oval nodes represent immune cells, red and blue diamond nodes represent the increase and decrease of metabolites in PsA, respectively. Lines connecting nodes indicate positive (red) or negative (blue) correlations. The full lines and dotted lines indicate significant correlation and suggestive correlation respectively. (B) Correlation of differential metabolites (PsA vs HC) and cytokines in PsA; (C) Correlation of differential metabolites (PsA vs RA) and Cytokines in PsA.

