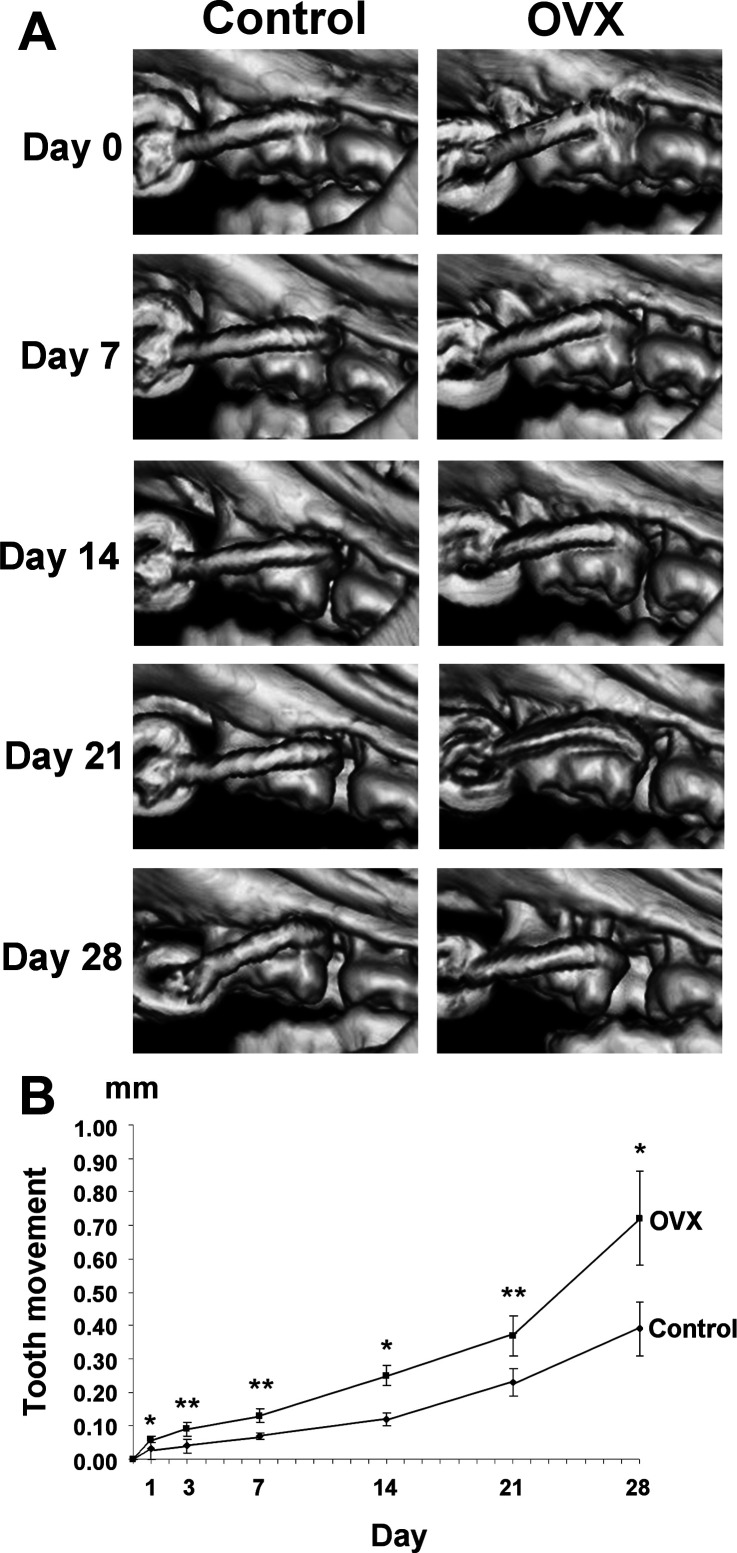
Figure 2.
Results of tooth movement. (A) Comparison of tooth movement between the control and the ovariectomy (OVX) group using the three-dimensional micro–computed tomography images at day 0, 7, 14, 21, and 28. (B) A graph of tooth movement at day 0, 1, 3, 7, 14, 21, and 28 between the control group and the OVX group. * P < .05; ** P < .01 (Mann-Whitney test).

