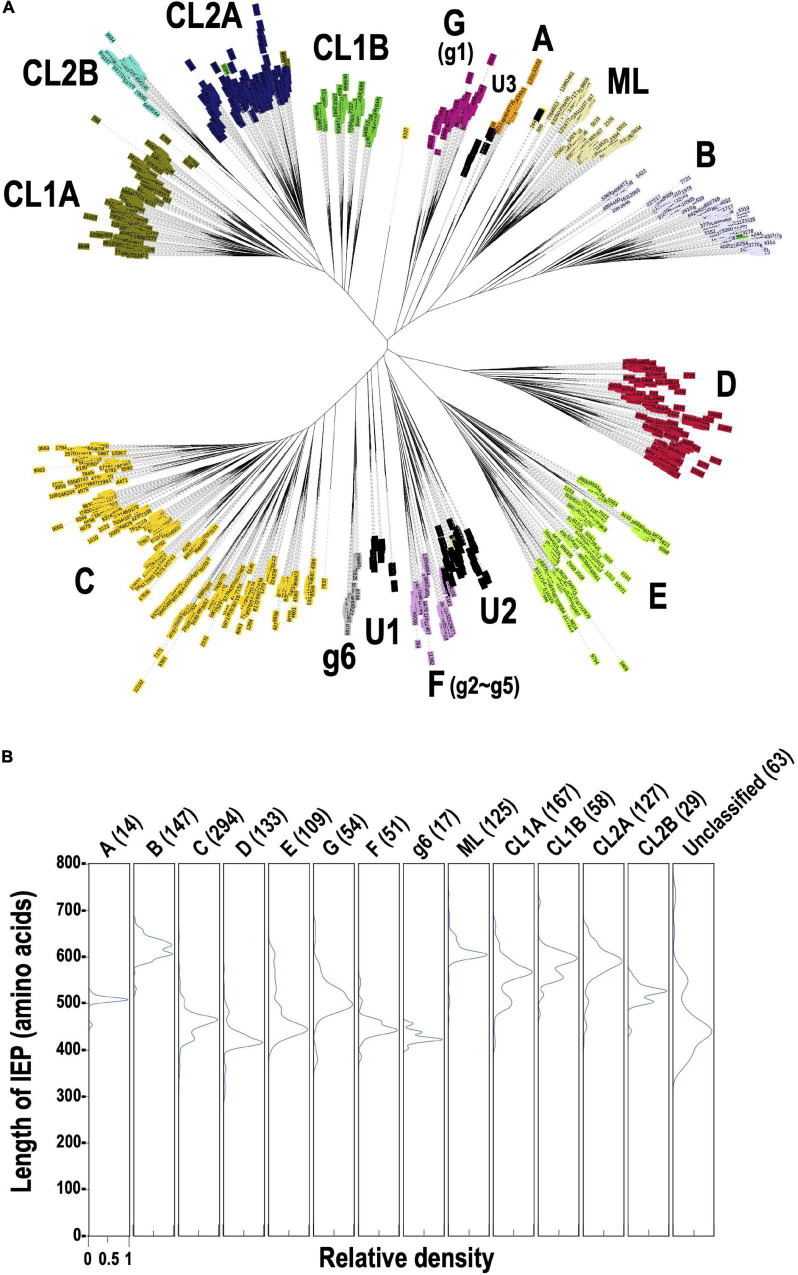
FIGURE 2.
Phylogeny of the prokaryotic IEPs detected in this study. (A) An unrooted phylogenetic tree of representative IEP sets (1,949 proteins) in bacterial G2Is. The representative IEP sets were selected based on a similarity analysis (see section “Materials and Methods,” Prediction of IEP Sequences). The types of IEP are: A (bacterial-A, orange), B (bacterial-B, lavender), C (bacterial-C, yellow), D (bacterial-D, red), E (bacterial-E, light green), G [g1] (bacterial-G [g1], violet), F [g2–g5] (bacterial-F [g2–g5], plum), g6 (bacterial-g6, silver), ML (light yellow), CL1A (olive), CL1B (green), CL2A (blue), and CL2B (turquoise). U1–U3 (black) are newly identified clusters that were previously annotated as “unclassified.” (B) Distribution of the amino acid lengths of each canonical IEP. The peak relative density is set as 1.0 in each case.

