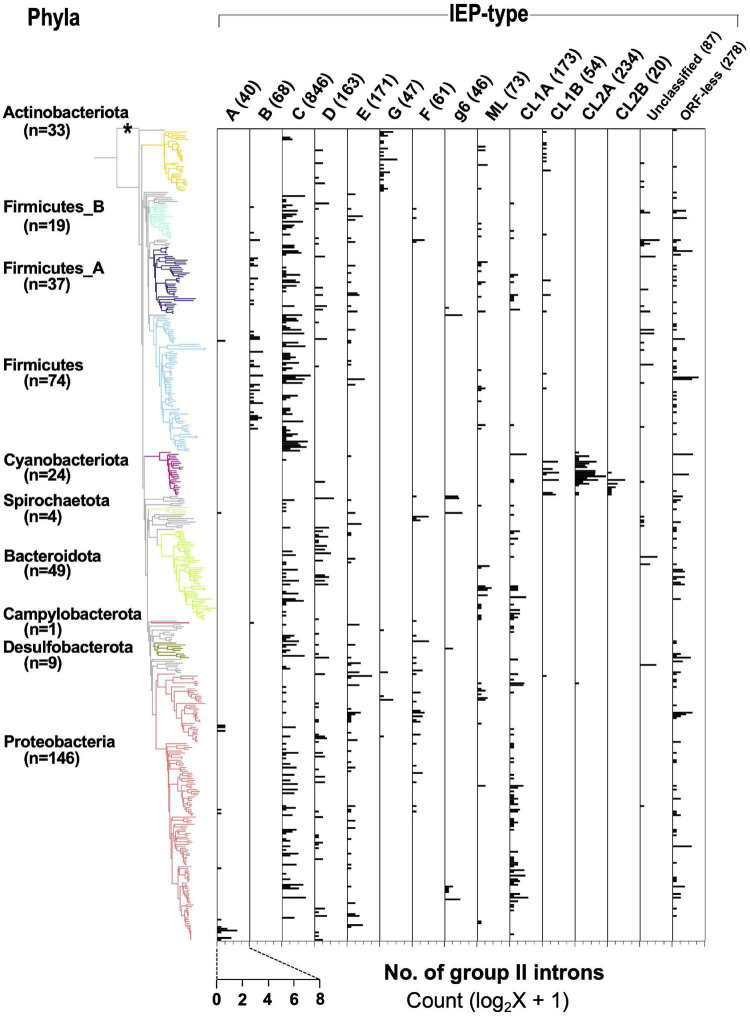
FIGURE 3.
Distribution of types of IEPs in the bacterial phylogeny. A bacterial phylogenetic tree was constructed from 443 representative bacterial genomes whose genome contain G2I(s) (see section “Materials and Methods”), and Candidatus Saccharibacteria oral taxon TM7x (RefSeq assembly accession: GCF_000803625.1) was used as the outgroup. See the legends of Figures 1, 2 for details. The horizontal axis represents the number of G2Is for each IEP type.

