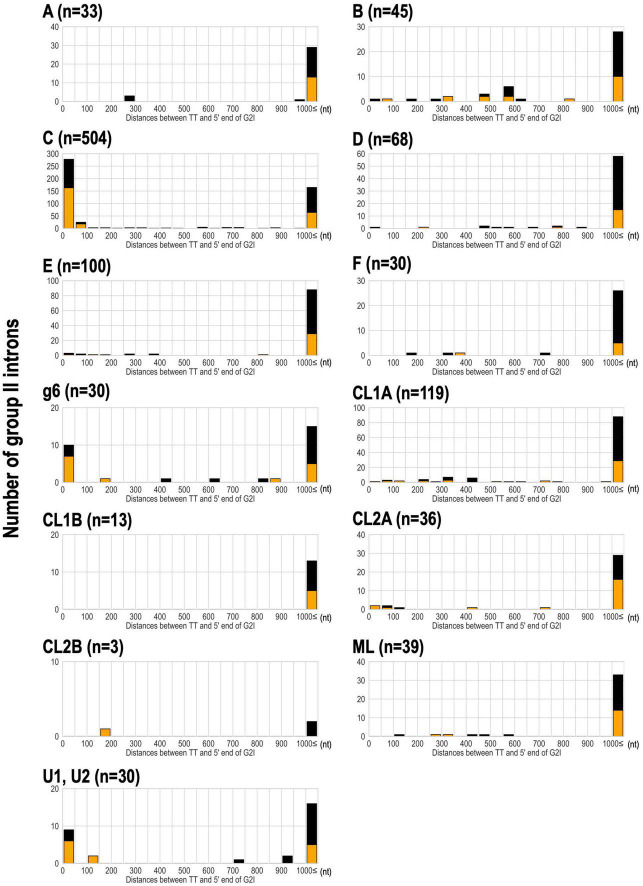
FIGURE 5.
Analysis of the distance between the transcriptional terminator and the 5′ end of G2Is for each IEP type in bacteria. The distance between the transcriptional terminator and the 5′ end of the G2I was calculated, and the number of G2Is at each distance is represented as a histogram for each IEP type. L-shaped terminators are shown in orange boxes and I-shaped terminators are shown in black boxes. G2Is with bacterial-g1 IEPs are not shown because their 5′ ends were not identified in this analysis. TT: transcriptional terminator.

