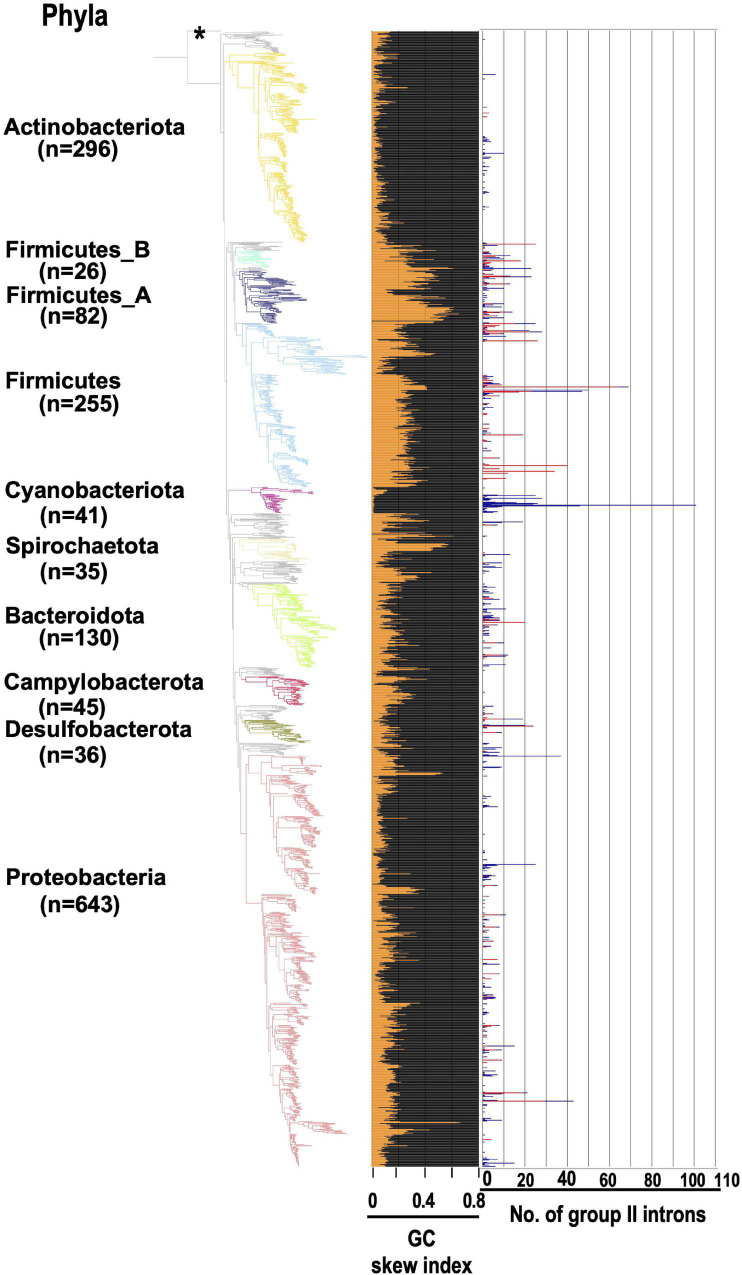
FIGURE 6.
GCSI and number of G2Is in the bacterial phylogeny. The GC skew index and numbers of G2Is in representative complete bacterial genomes (1,774 genomes) are shown. Bacterial phyla are shown on left and each corresponding branch on the bacterial phylogenic tree is colored. The numbers in brackets represent the number of genomes in each phylum. The position of the outgroup [Candidatus Saccharibacteria oral taxon TM7x (RefSeq assembly accession: GCF_000803625.1)] is indicated by the asterisk. The orange line in the middle panel indicates the GC skew index of the longest genome in each bacterial species. The numbers of G2Is are also shown on the right (red line: G2Is with bacterial-C type IEPs; blue line: G2Is with other IEPs).

