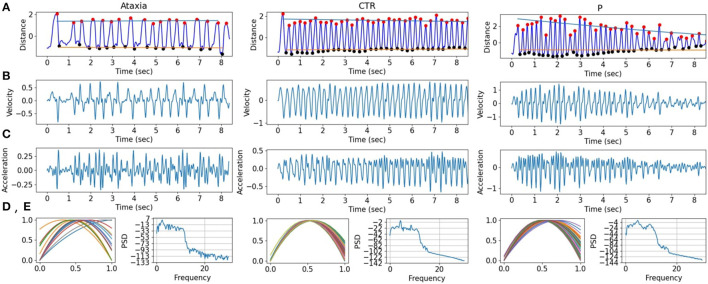
Figure 2.
Finger tapping signals in ataxia, control (CTR), and parkinsonism (P) example subjects. (A) The finger tapping, measured as the normalized distance between the tip of the index and the thumb. The peaks (red) and troughs (black) are marked with dots, and the slope for the peaks and troughs are drawn in blue and orange, respectively. (B,C) First and second derivatives of the FT signal are shown. (D) The normalized quadratic modeling of the finger tapping is plotted for each tap. (E) The power spectrum density of the FT.

