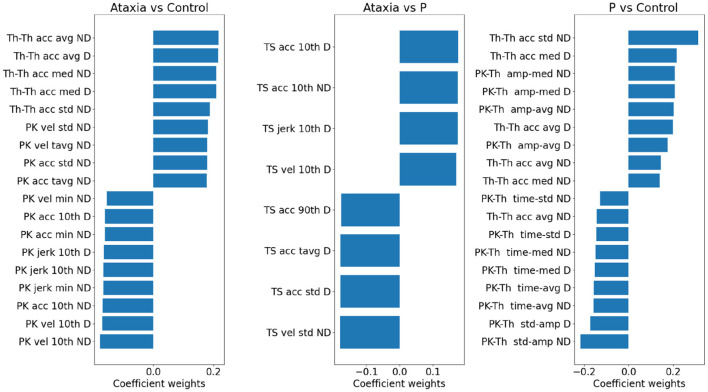
Figure 5.
Model weights for group classification in ataxia, control and parkinsonism (P). For each pair of groups, a bar plot indicates the contribution of individual features in discriminating group classes. The bar plot values reflect the model weights of the PC features *individual weight of the PC. Positive weights denote higher feature values in the first group and vice versa. Only the largest 2% of the features are plotted. Due to the L1 penalty, some features were assigned zero weights and not plotted, hence for the Ataxia vs. parkinsonism the number of features are smaller than the other group pairs. vel, velocity; acc, acceleration; avg, average; tavg, total or absolute average; amp, amplitude; med, median; pth10, 10th percentile; pth90, 90th percentile.

