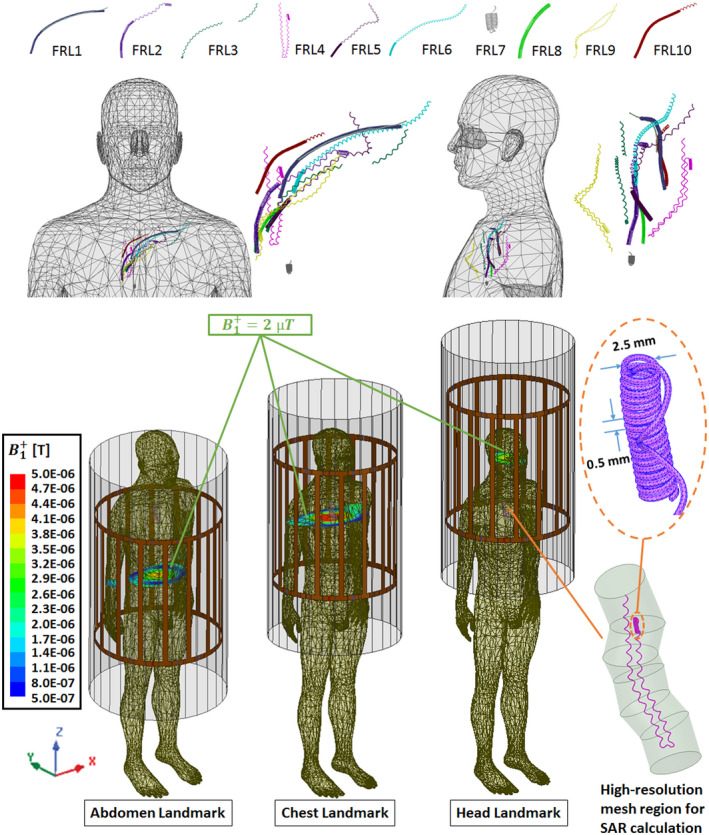
FIGURE 2.

Top row: Trajectories and detailed structures of FRL models extracted from 10 patients (namely FRL1‐FRL10). FRL 4 and 7 represent folded trajectories. FRL 9 was a case of a patient with two closely situated retained leads. Middle row: Front and side views of reconstructed FRLs and their relative locations in the human body model. Bottom row: Position of the body model inside the MRI coil at different imaging landmarks (i.e., abdomen, chest, and head). The high‐resolution mesh area around the lead in which 1g SAR was calculated is also shown
