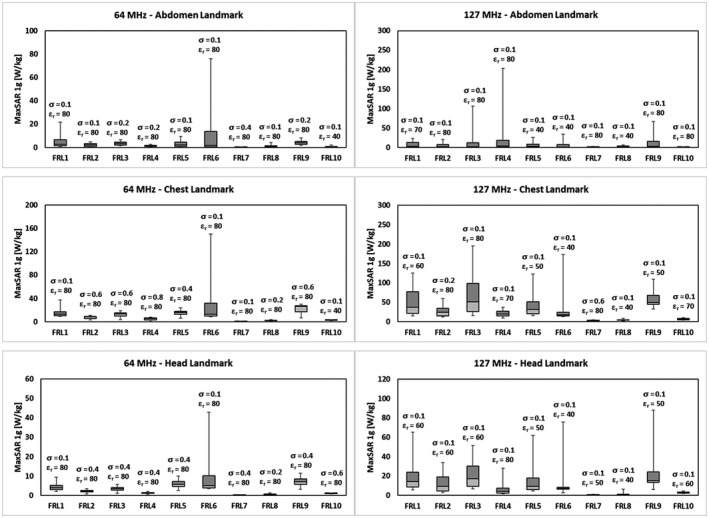
FIGURE 3.

Comparison of maximum value of 1g‐averaged specific absorption rate (MaxSAR1g) of all leads for each combination of landmark position and frequency. For each simulation, the input power of the coil was adjusted such that the spatial mean of the complex magnitude of B1 + (i.e., 1/2 ‖B1x + jB1y‖) was 2 μT on an axial plane passing through the iso‐center of the coil
