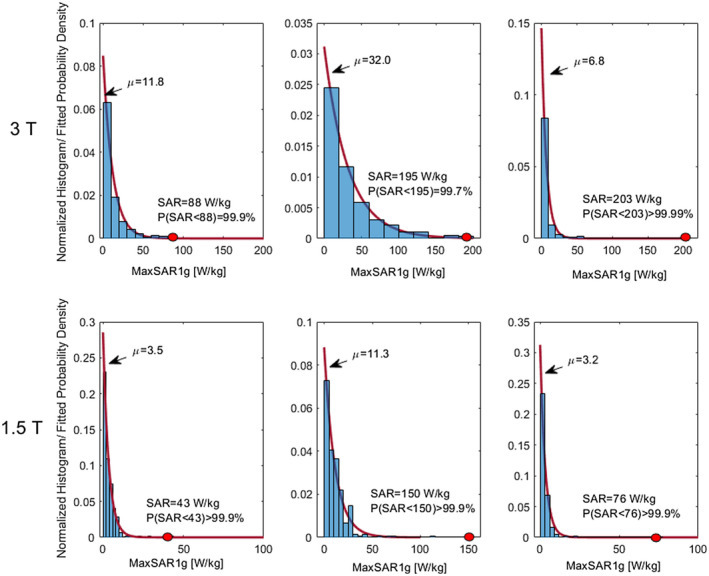
FIGURE 4.

Normalized specific absorption rate (SAR) histograms pooling N = 300 body models and FRL leads for each field strength and at each imaging landmark. An exponential probability density function (mean = μ) was fitted to the SAR distribution for each case. Red markers show the location of extreme cases associated with the body + FRL model that created the maximum SAR. The value of the maximum SAR and the probability of an individual SAR being less than this value are also given
