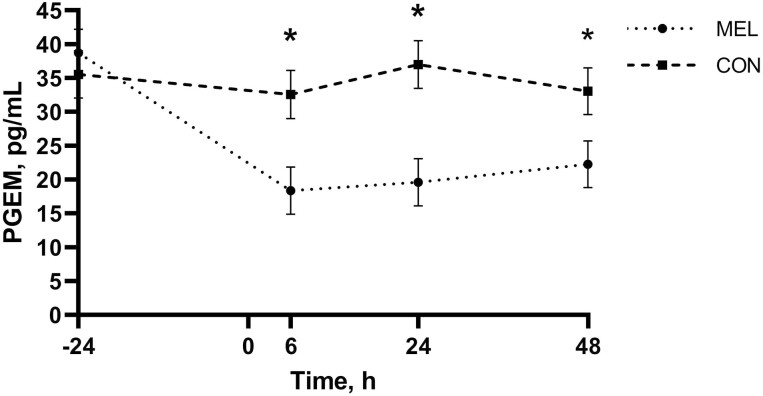
Figure 1.
Mean PGEM concentrations measured in pg/mL over the duration of the study for each of the two treatment groups receiving oral meloxicam at 1 m/kg (MEL; n = 35) or placebo (CON; n = 35) following hot-iron branding. Error bars indicate SEM. Asterisk denotes timepoints where a statistically significant difference (P ≤ 0.05) was observed between treatment groups.

