
Figure 7. The baiH-mediated microbiota composition shift exacerbates DSS-induced colitis in gnotobiotic mice.
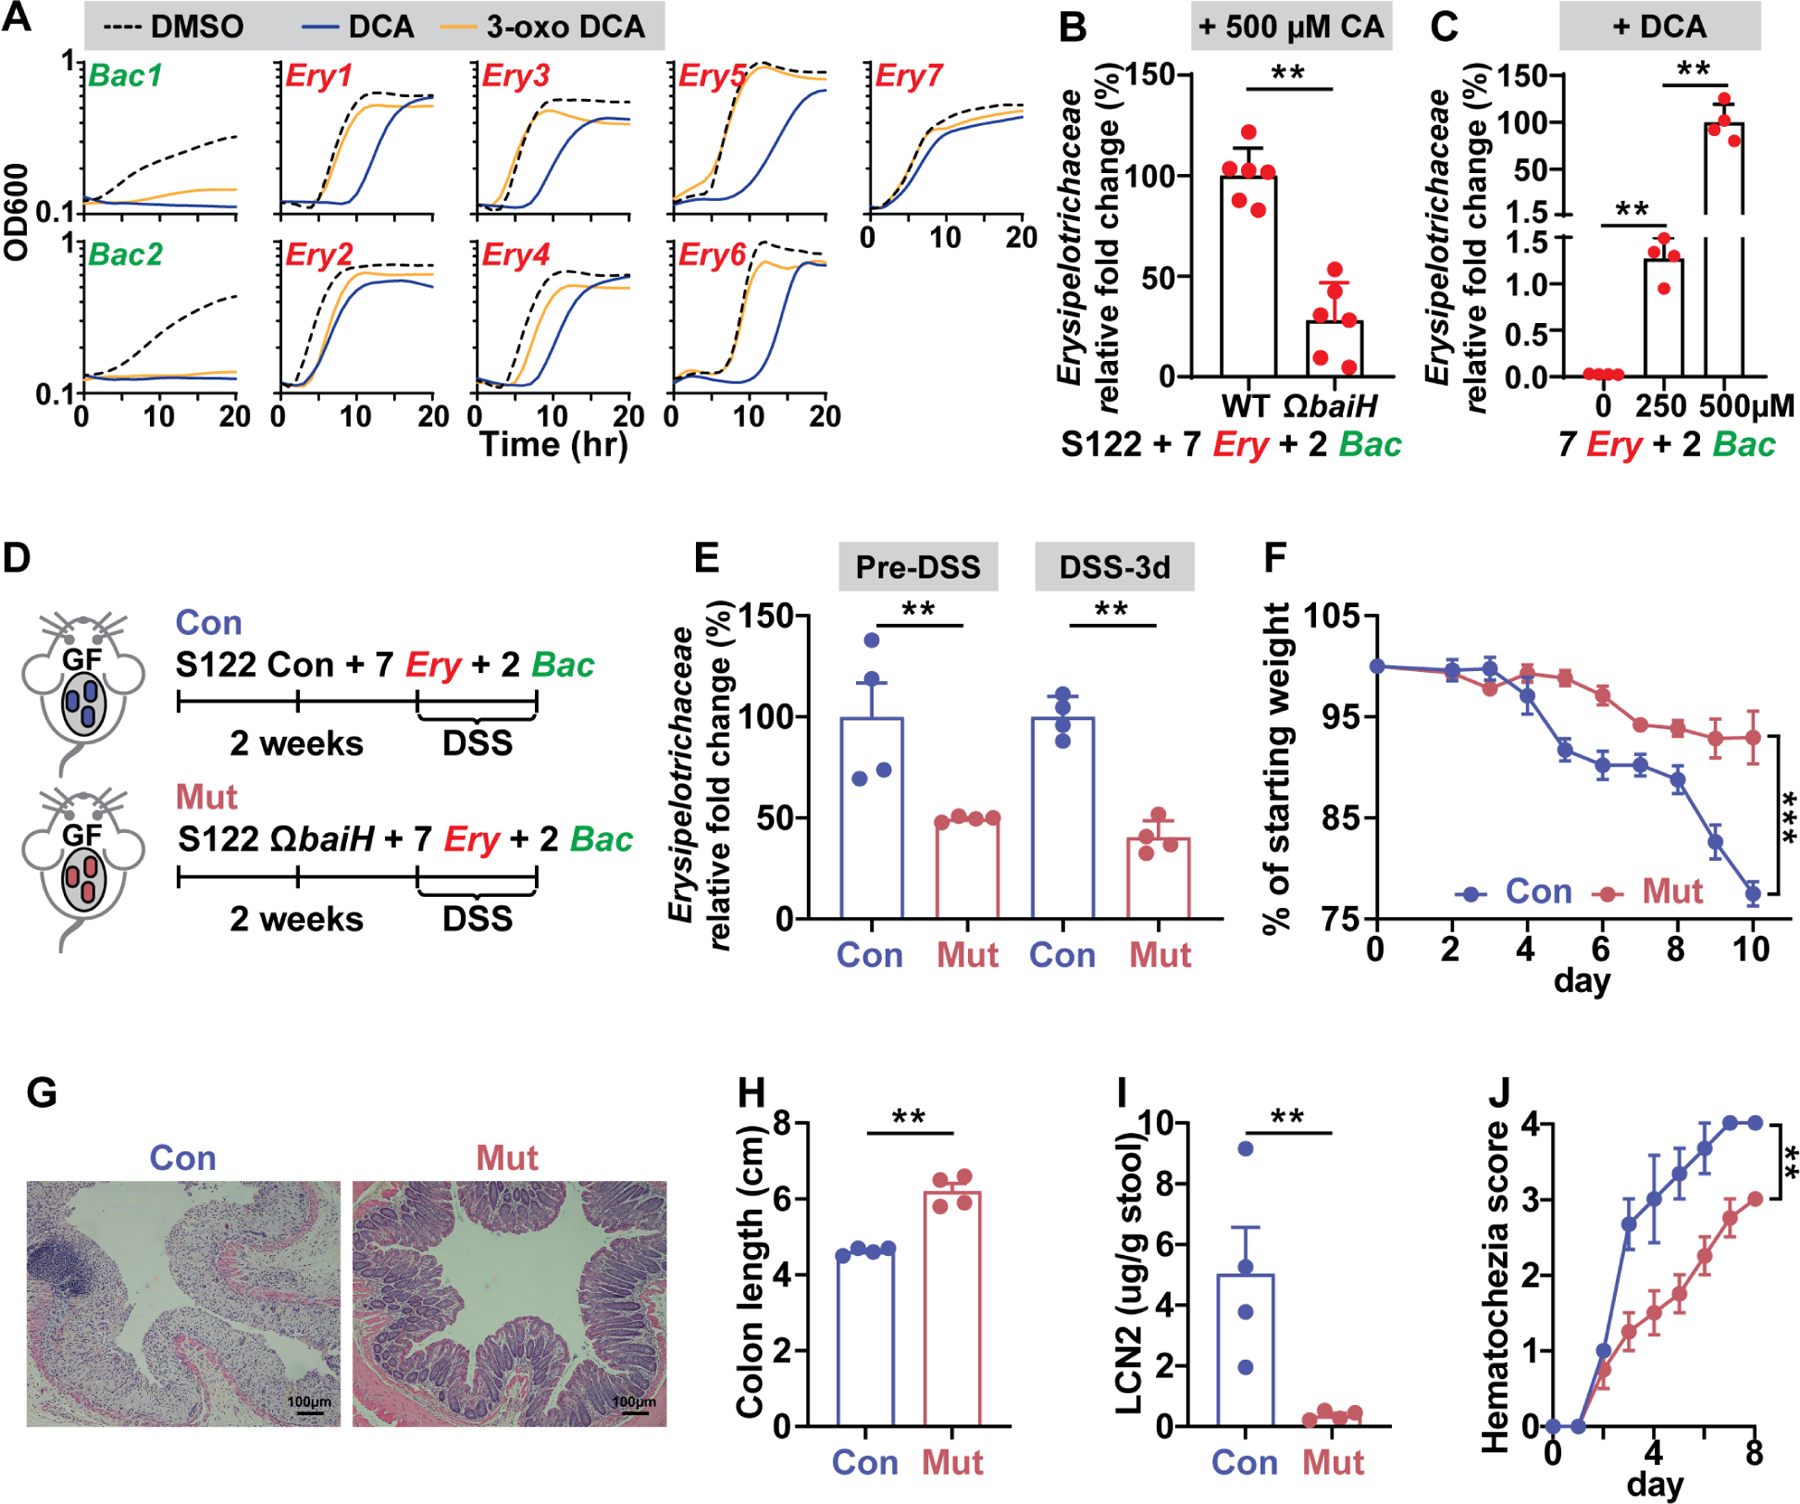
(A) The growth curve of two Bacteroides (bac) microbes and seven Erysipelotrichaceae (Ery) microbes in the presence of 500 μM DCA, 500 μM 3-oxo DCA, or DMSO control. The Erysipelotrichaceae microbes are more resistant to DCA and 3-oxo DCA than the Bacteroides microbes.
(B) The baiH gene drives expansion of Erysipelotrichaceae microbes in an in vitro consortium consisting of 2 Bacteroides (Bac) and 7 Erysipelotrichaceae microbes (Ery) with either the S122 control or ΩbaiH strain. 500 µM CA was supplemented as the substrate for the bai pathway. The relative fold change of Erysipelotrichaceae was assessed by qPCR.
(C) DCA drives expansion of Erysipelotrichaceae microbes in an in vitro consortium consisting of 2 Bacteroides (Bac) microbes and 7 Erysipelotrichaceae (Ery) microbes. DCA was supplemented at 0, 250, and 500 µM, respectively. The relative fold change of Erysipelotrichaceae was assessed by qPCR.
(D) DSS-induced murine colitis model was applied to the gnotobiotic mice colonized with a synthetic consortium consisting of the genetically tagged S122 control (Con) or ΩbaiH mutant (Mut) (by Group II intron) along with 2 Bacteroides (Bac) microbes and 7 Erysipelotrichaceae (Ery) microbes tested in (A), (B), and (C). Mice were colonized with the control or mutant strain for at least two weeks followed by 2.5% DSS for 8 days.
(E) The baiH gene drives expansion of Erysipelotrichaceae microbes in the context of host colonization before and during DSS treatment assessed by qPCR. The disease state was monitored by weight loss (F), hematoxylin and eosin (H&E) staining of the distal colon (G), colon shortening (H), fecal lipocalin-2 (I), and daily hematochezia score (J).
The data in (A to C) are from a representative experiment with three technical replicates (A), or with six or four biological replicates (B, C). Data shown in (F, H, I, J) are representations of n = 4 mice per group replicated in two or more independent experiments. In (F), % of starting weight was calculated by normalizing weights at sacrifice to starting weight. In (H) and (I), colon length and LCN2 data were analyzed using unpaired two-tailed Student’s T-test. In (F) and (J), % of starting weight and hematochezia score data were analyzed using Two-way ANOVA followed by the Bonferroni post hoc test (n=4). Data are shown as mean ± SEM. The asterisk indicates p-value < 0.05 (*), < 0.01 (**) or < 0.001 (***). The numbering of the strains corresponds to the strain information shown in Table S1.