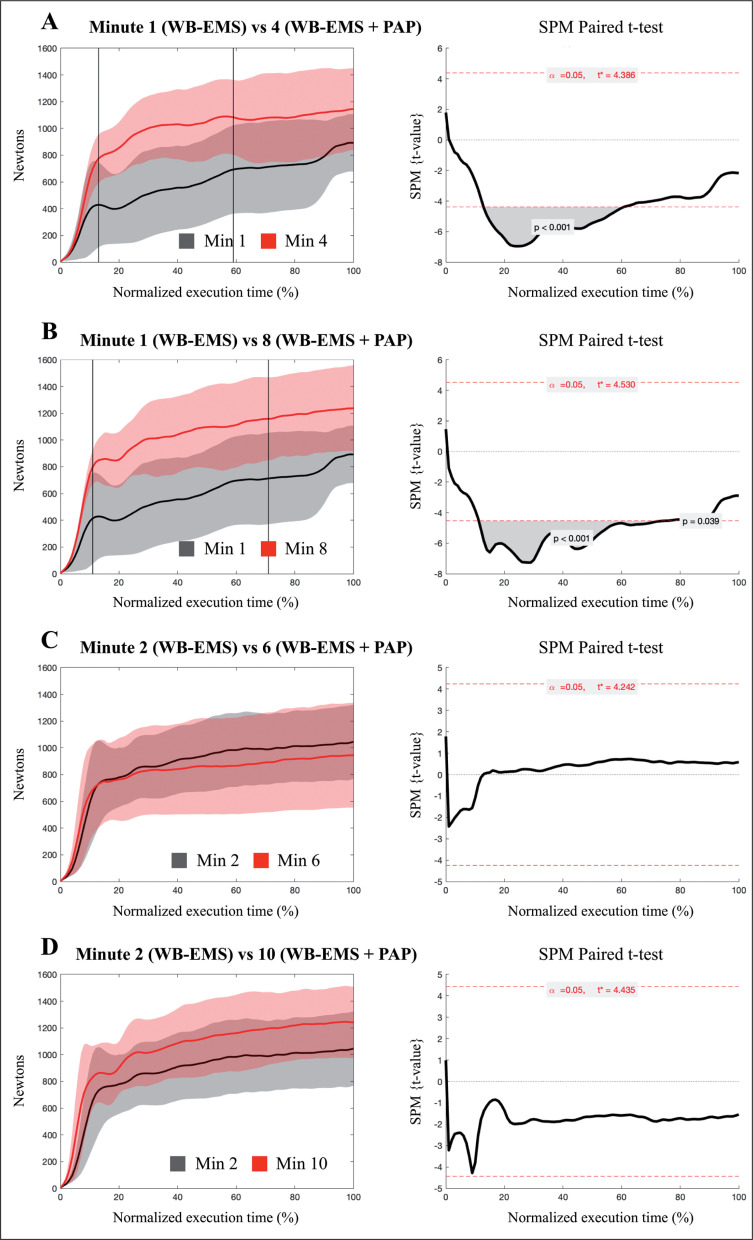
FIG. 5.
SPM1D-analysis for the comparisons between the WB-EMS and WB-EMS plus PAP conditions in maximum isometric strength kinematic curves for the minute 1 and 4 (Panel A), 1 and 8 (Panel B), 2 and 6 (Panel C), and 2 and 10 (Panel D). Solid lines represent mean and shaded areas standard deviation. SPM{t-value} is the trajectory Student’s t statistic or, equivalently, the mean difference curve normalized by sample-size normalized variance. The dotted horizontal line indicates the random field theory threshold for significance. Any clusters of SPM{t-value} that exceeded this threshold were considered significantly different. Vertical lines and right shaded areas represent the beginning and the end of the period in which significant results were observed. Abbreviation: PAP, post-activation potentiation; WB-EMS, whole-body electrostimulation.

