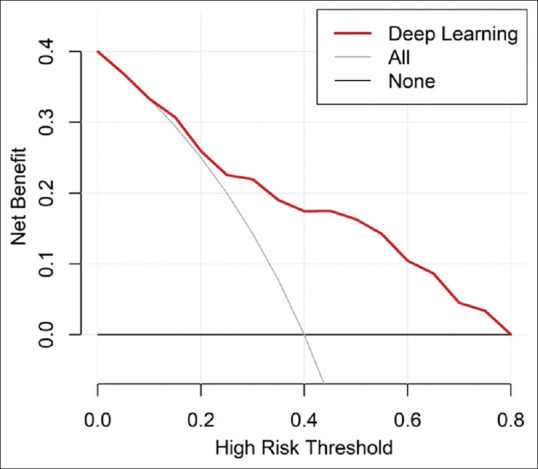
Figure 5.

Decision Curve analysis for the deep learning model. The y-axis measures the net benefit. The red line represents the deep learning model. The gray line represents the assumption that all the patients have feeding intolerance. The black line represents the assumption that no patients have feeding intolerance.
