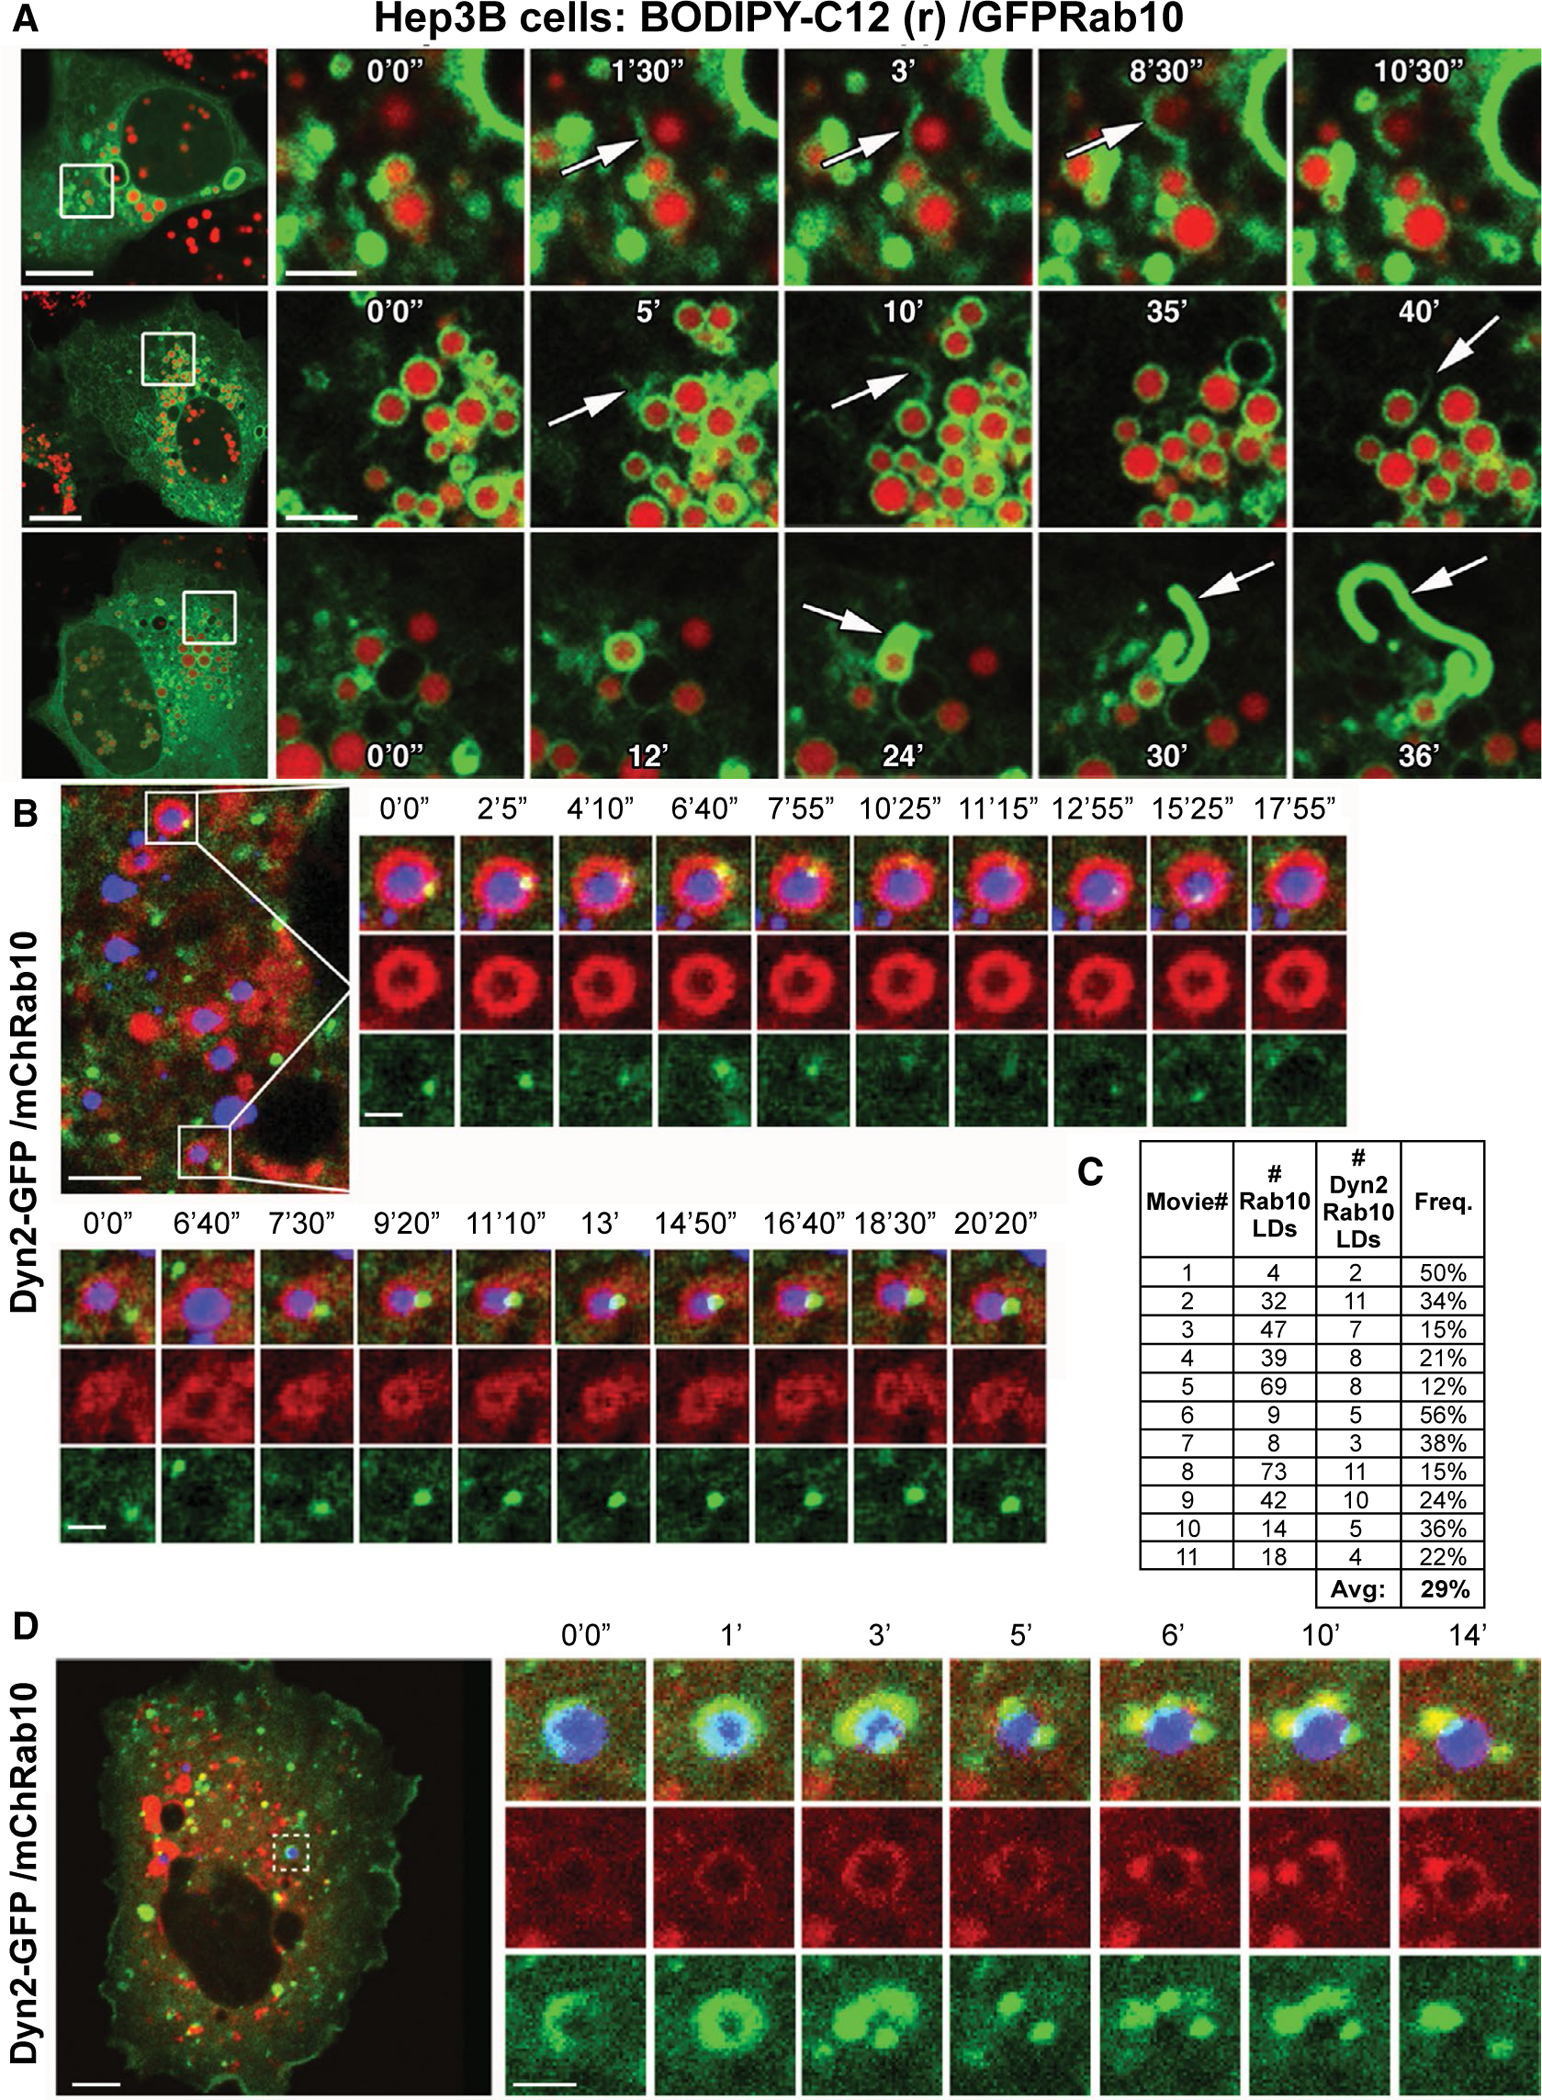
FIG. 3.

Dynamic remodeling of Rab10 tubules and interaction with Dyn2 on LDs. (A) Still images of live Hep3B cells showing dynamic extensions of GFP-Rab10–coated membrane tubules that are associated with LDs labeled with red fluorescent BODIPY-C12. (B,D) Live-cell confocal fluorescence microscopy time-lapse stills from Hep3B cells expressing GFP-Dyn2 and mCherry-Rab10. LDs are labeled by MDH (in blue). (C) Table displaying the frequency of colocalization between the mCherry-Rab10 and GFP-Dyn2 proteins on the perimeter of LDs within time-lapse series such as those displayed in (B) and (D). Micron bars: Panel A = 10 μm for low-magnification image, 2 μm for time-lapse image stills of boxed region; Panel B/C = 5 μm for low-magnification image, 1 μm for time-lapse image stills of boxed region. Abbreviations: Avg, average; Freq., frequency.
