Figure 1.

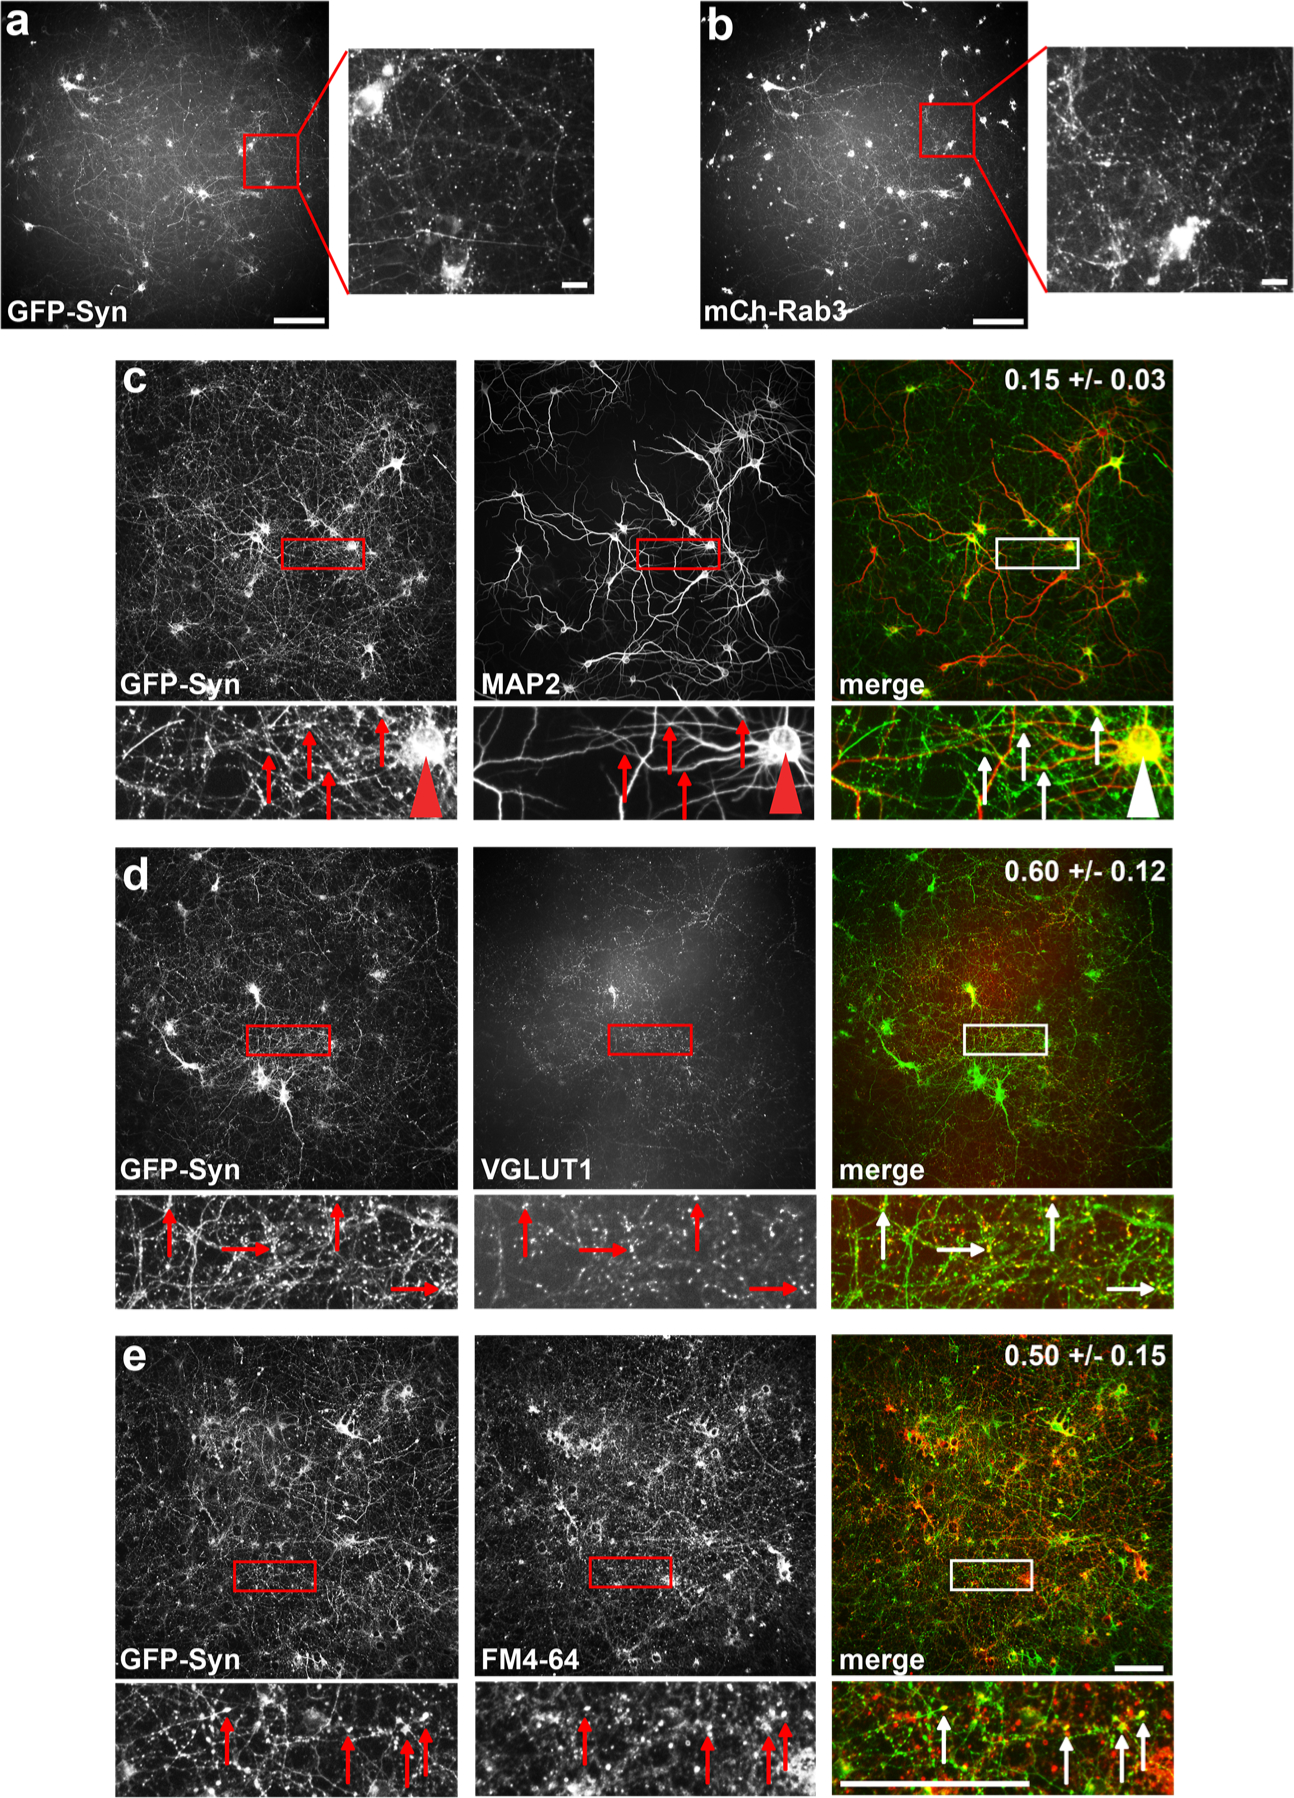
Development of high-throughput screening platform to detect synaptic labeling. (a) Original and zoomed images of GFP-Synapsin-expressing cortical neurons in 96-well plate format, acquired via high-throughput screening microscope. Size bar is 100 μm for original image, 10 μm for zoomed image. (b) Same as (a), but neurons are expressing mCh-Rab3. (c–e) Original and zoomed images showing colocalization of GFP-Syn with MAP2, VGLUT1, and FM4–64. The fraction of GFP-Syn puncta that colocalize with each marker is indicated on the merged image. Arrows indicate GFP-Syn puncta and corresponding immunostaining of the marker; arrowhead in (c) indicates a neuronal cell body. Size bars are 100 μm.
